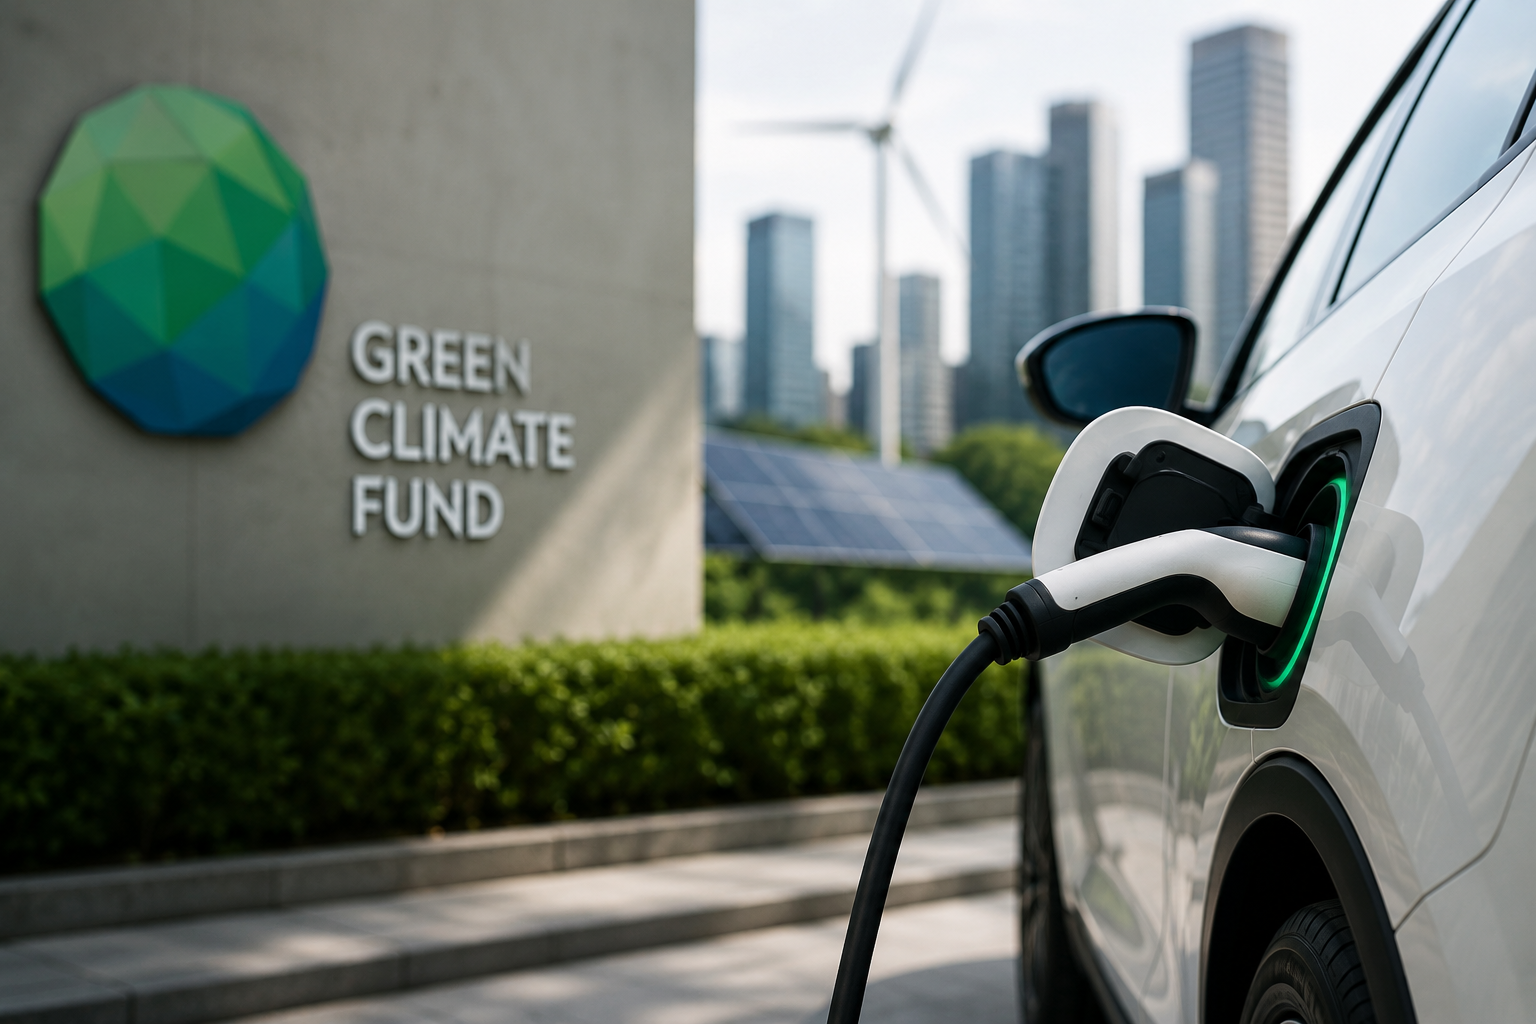
Climate finance has become one of the most important enablers of global climate action. Countries require large-scale capital to shift from fossil-fuel-based systems towards low-carbon, climate-resilient and inclusive development pathways. Climate finance does more than fund assets. It reduces investment risks, supports new business models, strengthens institutional capacity and helps governments and private players move climate solutions from pilot scale to market scale. Several international climate finance institutions support this transition such as Green Climate Fund (GCF), Global Environment Facility (GEF), Adaptation Fund, Climate Investment Funds (CIF), others. The GCF has emerged as one of the world’s largest dedicated climate funds to enable low emission, climate resilient development pathways in developing countries.
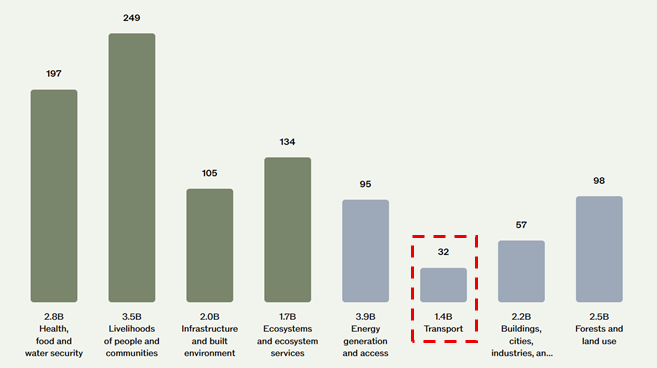
Over the years, GCF has supported mitigation, adaptation and cross-cutting projects across Health, food and water security, Livelihoods of people and communities, Infrastructure and built environment, Ecosystems and ecosystem services, Energy generation and access, Transport, Buildings, cities, industries, and appliances and Forests and land use. It maintains a 50:50 allocation[1] objective between mitigation and adaptation and direct at least half of adaptation finance towards Least Developed Countries, Small Island Developing States and African States. In total, GCF has approved nearly 350 projects and has committed around USD 20.1 billion (disbursed ~USD 6.8 billion) in resources and mobilised an amount of around USD 59.8 billion as co-financing[2]. Within this portfolio, transport has become an important sector for GCF because it remains one of the fastest-growing sources of greenhouse gas (GHG) emissions in developing economies. The sector has received around USD 1.4 billion (as shown in figure) in funding and supported a range of low-emission public transport, transport electrification, non-motorised transport, transit-oriented development and climate-resilient transport infrastructure.
e-Mobility has emerged as a focused and fast-growing investment theme within the transport sector. GCF has supported at least five dedicated e-mobility programmes (as shown in table) These five programmes account for ~USD 778.5 million in GCF financing[3].
[1] GCF, Portfolio, Dashboard, https://www.greenclimate.fund/portfolio/dashboard
[2] GCF, https://www.greenclimate.fund/
[3] GCF, Portfolio, Transport, https://www.greenclimate.fund/portfolio/all?area%5B%5D=Transport
| Parameter | FP186: India E-Mobility Financing Program[1] | FP189: E-Mobility Program for Sustainable Cities in LAC[2] | FP195: E-Motion: E-Mobility and Low Carbon Transportation[3] | FP225: E-Mobility Program[4] | FP237: E-Motion: E-Mobility and Low Carbon Transportation[5] |
| Approved year | 2022 | 2022 | 2022 | 2024 | 2024 |
| Status | Ongoing | Ongoing | Ongoing | Ongoing | Ongoing |
| Project focus | EV Financing PlatformEV Owners/ Operators Charging Infrastructure | Electric BusesEV FleetsElectric Boats/ VesselsHydrogen and V2G | e-Bus FleetsElectric Light Commercial VehiclesFast Charging | e-Bus FleetsNon-Motorised TransportClimate-Resilient Urban Transport Infrastructure | Large-Scale EV and Infrastructure InvestmentBusiness Model Testing |
| Countries | India | Barbados, Chile, Colombia, Costa Rica, Dominican Republic, Jamaica, Panama, Paraguay, Uruguay | Panama, Paraguay, Uruguay | Armenia, Georgia, Indonesia, Kazakhstan, Kyrgyzstan, Nepal, Uzbekistan | Argentina, Brazil, Colombia, Costa Rica, Dominican Republic, Mexico, Peru |
| Total project cost (USD m) | 1,497 | 450 | 231 | 454.4 | 350.9 |
| GCF contribution (USD m) | 200 | 200 | 76.6 | 169.9 | 132 |
| Co-financing (USD m) | 1,297 | 250 | 154.4 | 284.5 | 218.9 |
| Disbursement till now (USD m) | 50 | 4.94 | 10.45 | 5 | 7.02 |
| GCF instrument (USD m) | Equity | Grant: 55 Loan: 145 | Grant: 9.82 Loan: 66.80 | Grant: 64.92 Loan: 105 | Grant: 26.15 Loan: 105.82 |
| Tenure / interest rate | – | Senior loan mitigation (60%) Tenure: 20 years Interest rate: 0.75% Senior loan Adaptation (40%) Tenure: 40 years Interest rate: 0% | Senior loan Tenure: 15 years Interest rate: 0.75% – 1.10% | Senior loans 1 (15.75%) Tenure: 40 years Interest rate: 0.0% Senior loans 2 (84.25%) Tenure: 20 years Interest rate: 0.75 % | Senior loan Tenure 20-year Interest rate: 0.75% |
| Key terms of GCF finance | Provides equity to mobilise private-sector institutional capital and reduce EV financing barriers | Blend grants and concessional loans to reduce high upfront EV and infrastructure costs | Combines concessional debt with grant-based TA for policy, business models and capacity building | Uses loans for investment and grants for TA, climate-proofing and Programme Preparation | Uses grants for ecosystem strengthening and senior loans for large-scale e-Bus, Charging and urban mobility upgrades |
| Key terms of co-finance (USD million) | Equity: 205 Loan: 1,092 | Grant: 5 Loan: 195 Other: 50 | Equity: 30.44 Loan: 121.99 In-kind: 1.98 | Grants: 44.48 Loan: 240 | Grants: 51.68 Loans: 167.24 |
| Benefit to project/ country | Lowers financing barriers for India’s EV ecosystem & supports fleet electrification at commercial scale | Helps LAC cities move from pilots to commercial EV deployment | Supports cleaner, safer and reliable transport in countries | Supports low-emission and climate-resilient transport across countries | Reduces public/ private investment risks and scales e-mobility countries |
[1] GCF, India E-Mobility Financing Program, https://www.greenclimate.fund/portfolio/projects/fp186
[2] GCF, E-Mobility Program for Sustainable Cities in LAC, https://www.greenclimate.fund/portfolio/projects/fp189
[3] GCF, E-Motion: E-Mobility and Low Carbon Transportation, https://www.greenclimate.fund/portfolio/projects/fp195
[4] GCF, E-Mobility Program, https://www.greenclimate.fund/portfolio/projects/fp225
[5] GCF, E-Motion: E-Mobility and Low Carbon Transportation, https://www.greenclimate.fund/portfolio/projects/fp237
GCF has mobilized nearly USD 3 billion in total investments through its e-mobility portfolio including ~USD 778.5 millions of direct GCF financing across multiple regions in Asia, Latin America and the Caribbean. This financing mix highlights that GCF extends beyond grant funding. The fund strategically combines concessional loans, equity investments and grant support to de-risk investments, mobilise private capital, improve project bankability and accelerate the commercial-scale deployment of electric mobility solutions across emerging markets.
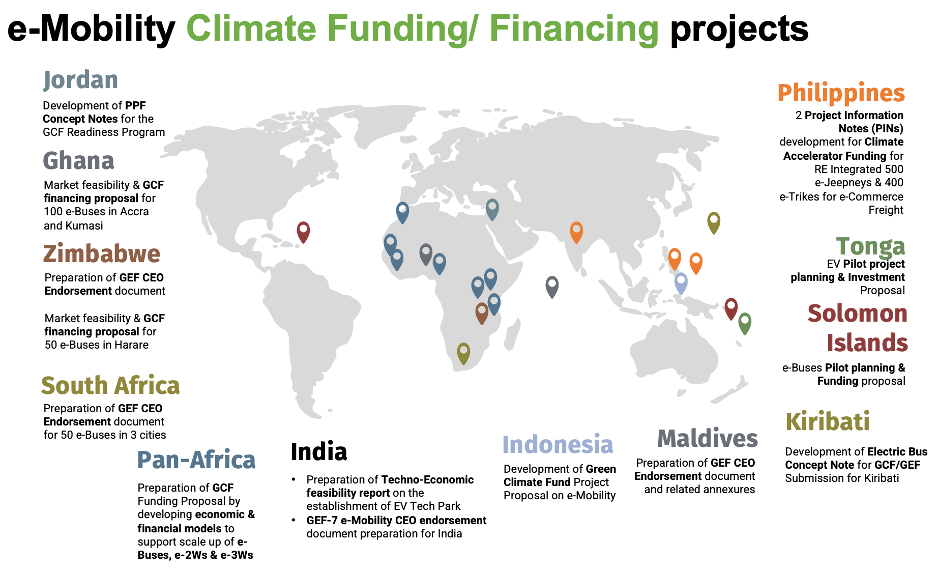
This growing role of GCF in e-mobility is closely aligned with pManifold’s work in climate finance and transport decarbonisation. pManifold recently supported the preparation of a full GCF funding proposal for an electric bus transition programme in a Southeast Asian country. The programme was structured around an e-Bus Financing Facility for urban public transport electrification and aimed to accelerate the deployment of 2,700 e-buses (across different sizes) and associated charging infrastructure. The proposal outlined a total project size of USD 240 million comprising USD 5 million for TA and USD 235 million for investment support, making it a finance-led intervention supported by policy, institutional and market development activities. The concessional loan financing instrument was designed to provide long-tenor, lower-cost capital to improve project viability, de-risk investments and mobilise private-sector participation in public transport electrification. The grant was designed to address non-financial barriers such as policy development, regulatory reform, institutional strengthening, stakeholder capacity building, market development and knowledge-sharing.
Disclaimer: This blog is based on publicly available research, industry reports, news/ articles and the author’s analysis and is intended for informational purposes only. The views expressed are solely those of the author and should not be construed as professional, financial, legal or technical advice. Where external content is used, due credit has been provided to the original source to the best of the author’s knowledge. If any content from this blog is reproduced, adapted or shared, appropriate attribution to the original author and this blog is required.


 Out of the variants available, ‘Input based Distribution Franchisee’ model has recently seen an increase, currently with five cities across India, out of which distribution in three cities was handed over to private companies in 2011. Below shown is the indicative content of the report. Input based Distribution Franchisee, by far, has been mostly used operating model in urban areas.