Leveraging Customer Perspective for a stronger Onsite, Local Due-Diligence in Pre-Bid phase

Leveraging Customer Perspective for a stronger Onsite, Local Due-Diligence in Pre-Bid phase

Consumer centricity has returned or finding its way into most of the businesses in emerging economy like India. Consumer ‘needs’ and ‘willingness to pay’ for good quality products and services is driving a whole new era of competition. It first started in luxury industry with high economy class consumers, where there was established ‘willingness to pay’ for better services and then slowly start penetrating into other sectors and also lower economic classes and raising their ‘aspirations’. These phenomenon is creating a whole new market and driving innovations from bottom-to-top. The aviation, telecom (mobile and internet) and various other industries has seen this Consumer cycle. India’s Power Distribution sector has begin its journey of enabling ‘diversity’ and adding more ‘choices’ to its electricity customers. Like other sectors, the cycle first began with high volume or developed consumers through ‘top-down’ innovation like ‘Open Access’ and now we have started hearing of ‘bottom-up’ innovation like ‘Pre-paid metering’, ‘Net-metering’ and ‘Distributed Generation based Distributed Franchisee (DGBDF)’.

The to-be leaders in the Power Distribution space will soon have to learn this change that is sweeping the country and include the end-consumers into the designing and co-creation of solutions and soon also accept equally the urban and rural consumer mix to drive bottom-top innovation. The new saga is to forgo or overcome references like BPL, APL, agri (or rural), tariff subsidies and free power, but start innovating scalable ventures to meet the needs and challenge. Grameen Micro Financing model first innovated at Bangladesh is now widely accepted and MFI is a very big and fast growing industry with strong developing linkages to the main streamline capital industry through various derivatives.Remember this all begins with a 3 letter word – KYC i.e. ‘Know Your Customer’. Its an important phase after you are done with Market Analysis through KYM i.e. ‘Know Your Markets’. KYC should be a pre-cursor for high confidence KYI i.e. ‘Know Your Investments’.

Our recent discussions with prospective bidders for Distribution Franchisee tenders in 9 districts of Madhya Pradesh (MP) was full of encouragement for our recently conducted ‘Customer Satisfaction study for Electric Utilities’ in those regions.

  • Most companies easily perceived our work’s importance to operating  Distribution Franchisee post the bid win for regular (internal & external) benchmarking of Customer Satisfaction to evaluate and better prioritize their system investments and efforts.
  • Almost all experienced companies in running Distribution extended the applicability of our Customer Satisfaction research also to the pre-bidding phase. They found it will add an important perspective to their already on-ground technical due-diligence and help them validate their assumptions on Capex and Opex plans for bidding.

How does pManifold’s Customer Satisfaction study fit in the Pre-Bidding phase?

In lack of missing information on Asset health in the RFP and low confidence on quality of data, the bidders are left with no choice but to take due-diligence on-site for collecting this information and then estimating Capex, Opex and Load growth across various customer segments.

The study allows bidders to jumpstart on-site due-diligence by pointing location specific key areas of concerns for power delivery services across 28 key business performance indicators. This becomes input to on-site due diligence team for more focused causal analysis of specific locations for specific attributes. Additionally, it is more applicable for the districts of Madhya Pradesh where habitation is scattered and geographic terrain is hard to cover, representatively, to derive any useful consolidation of on-site findings and then defining investment numbers.

The factors used in the pManifold’s Customer Satisfaction model are – Power Quality, Reliability, Metering, Billing, Payments, Information systems, Customer services, Communication, Price and others. (See detailed framework)

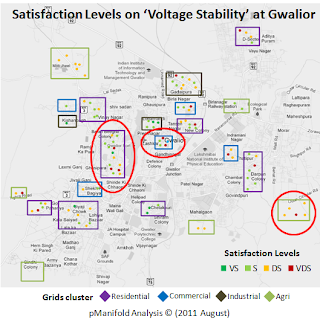
Voltage Stability’ Map of Gwalior city
The GIS map indicates the sample respondent’s satisfaction level (in red, orange and green dots) for specific attributes. The consumers are clustered into 4 categories namely Residential, Commercial, Industrial and Agriculture marked by 4 different colored box boundaries. Grids with high relative numbers of Red (Very Dissatisfaction) and Orange (Dissatisfaction) dots should raise a trigger for on-site team to look into causes of dissatisfaction.

  • Voltage stability seems to be problem in Gwalior city with overall more than 50% dissatisfaction. High paying urban consumers including ‘Commercial’ and ‘Residential’ also seems to struggle with the problem. Rural areas outside city limit has aggravated voltage stability issues.
  • Visualizing the results in this GIS form will aid the on-site due-diligence team to go for specific customer segmented pockets and prioritize their time. The ‘voltage stability’ interventions will have major impact on Capex planning for the area.

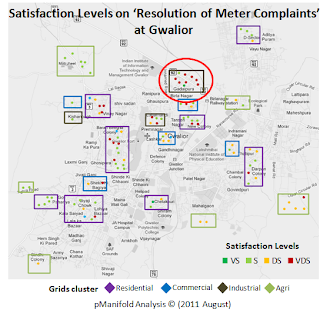
‘Resolution of Meter Complaints’ Map of Gwalior city:
Industrial consumers are supposedly high return customers for utilities revenue.

  • In Gwalior city, the Industrial belt of Gadaipura seems to suffer with significant ‘customer service’ related problems on ‘Metering Complaint Resolution’ to result into 67% ‘Dissatisfaction’ indicated by red and orange dots.
  • Gwalior has almost 100% Electronic meters for Industrial consumers. The problems if vested into replacing meters then it would result into another huge Capex involvement for the Distribution Franchisee. If problem is more vested into improving processes and protocols for handling customer services and aiding with Meter testing services, then that would have implication on Opex planning for resources, inventory and lab testing.
  • There are more correlation analysis that come as supplements in the CSAT study which indicate customer’s willingness to pay for additional premium services, its sensitivity to ‘Prices’ and ‘Value for Money’ and also its acceptance to privatised distribution. All these together with socio-economic indicators and demographics of the area influence the customer acceptance of the Distribution Franchisee model and initial roll-out of DF operations and hence its associated delays, contingencies and Risks to the Investments (both systemic and idiosyncratic types).

Similar maps and more insights are available for 28+ attributes and can be effectively used to direct on-site due-diligence team, validate results from on-site due-diligence against CSAT results and have more confidence on Capex and Opex estimation. Such comparative information on 9 districts could provide another validation on selection of one district over the other for final bidding. (See pManifold’s earlier blog Distribution Franchisee Attractiveness – Comparison for Madhya Pradesh’s 9 districts)

For individual reports on each region, please get in touch with Rahul Bagdia, +91 956 109 4490, rahul.bagdia@pManifold.com.

Bottom-up innovation: From Micro Grid in Indian villages to Smart Grid for urban Discoms

Bottom-up innovation: From Micro Grid in Indian villages to Smart Grid for urban Discoms

Bringing electricity to rural areas that never may see the grid is a great boon to both people’s quality of life and the region’s economy. Smart Grid Technology or Renewable Microgrid is the topic of this discussion to improve operational and business efficiency of Indian Power Utilities.Grampower, a energy technology company is working on addressing the electrification challenges in India.pManifold recently spoke to Mr. Yashraj Khaitan, Co-founder and CEO of Grampower. The company sets up energy efficient Smart Microgrids in remote areas to provide on-demand, reliable electricity to telecom towers and rural households with an affordable prepaid purchase model. He has been instrumental in raising over USD1.7 million for the company, and leads product and business development and partnership building to scale the company’s operations.The below shared are the author’s personal views and not to be associated with any of his company’s and other associations.

Q1) What is one typical micro grid size/ investment/ returns: # of connections, brief equipment specs, investments, ROI, Payback?

A)

  • A microgrid in an off grid area that is capitally and operationally viable must be 10 kW and above with about 50% of it’s generation capacity dedicated towards guaranteed daytime loads such as telecom towers, shops, cold storages, cottage industries, schools, etc. The remaining 50% needs to be targeted towards domestic loads to provide ‘lifeline power supply’ to consumers during the night. Typically 80-100 families can be served in this configuration and the payback lies between 4-5 years.
  • Equipment specs – On the generation side, we use crystalline solar panels and inverters with maximum power point tracking controllers to maximize power drawn from the solar panels. The storage used is tubular lead acid batteries. The distribution infrastructure is setup by us and comprises cement poles and insulated aluminum cabling till the household level. Each household is given Gram Power’s proprietary Smart Prepaid Meter that we are able to control remotely. These meters ensure 100% payment collection, make consumers aware of their power consumption and allow them to control their monthly expenses, and enable to Gram Power to identify and eliminate any form of meter or distribution line tampering for power theft. Typical, solar generation infrastructure including solar panels, inverters, batteries, structures, etc. is about 60% of system cost. 20% is the smart grid infrastructure including meters, communication, remote monitoring, and payment system. Balance 20% is installation and commissioning expenses.
  • Micro-grids that need to be setup for small hamlets that don’t have much commercial load can be made operationally viable with Gram Power’s Smart Distribution System. Hence for such villages, we work with the State and Central Governments to fund the capital cost of the system. The prepaid meters, theft detection systems, and our payment model ensures that enough revenue is collected so as to keep the plant running for 25 years, i.e., the lifetime of the solar panels.
  • The long term solution however, is grid connected microgrids, which is what we are focusing on now.

Q2) What changes you request to bring scale-up of Generation tied Distribution systems in India – customer behavior, Grid sharing & Tariff regulations, others?

A)

  • Customer behavior will change in the following ways, as already demonstrated in our systems:
    • They will become energy conscious as the meters inform them of their rates of consumption
    • Power consumption will reduce as consumers pay for every unit that is metered
    • This reduction in consumption essentially increases the amount of power available for the DISCOM to sell to industries where revenue is higher
  • I believe the following model should be supported to promote intelligent and sustainable rural electrification:
    • DISCOMs setup DFs in a PPP mode for villages or entire feeders that have over 40% commercial losses and where power supply is erratic
    • The DISCOM and DF jointly fund the replacement of energy meters with Smart Prepaid Meters and theft detection systems in the grid
    • The DISCOM will sell power to the DF at an agreed bulk tariff and the DF will sell power to the consumer at the regulated tariff through multiple retail outlets in the village just as cell phone recharge is sold
    • DF should have the permission that power supply is automatically disconnected to households that tamper the meter or distribution lines or run out of credit
    • Those companies should be selected as DF who are willing to invest in setting up locally installed renewable generation in the village to supplement grid supply and make power supply more reliable
    • The DISCOM will charge the DF for all power consumed at a single point

Q3) What realised efficiency can Micro grids bring to Indian Discoms? What good and immediate market opportunities you see in this space, in addition to rural?

A)

  • A Gram Power Smart Microgrid with solar generation and battery storage for a village of 100 homes is only 30% of the cost of extending the national grid by 15 km. We have demonstrated 100% payment collection and 0% power theft in our systems. Hence the realizable efficiency for DISCOMs in areas where our distribution technology is used on the national grid, can be easily estimated based on what losses DISCOMs are incurring today.
  • For microgrids, I see the following tappable markets:
    • Remote hamlets funded through DDG schemes
    • Urban colonies being privately constructed should have a requirement for have a microgrid to meet its power needs when grid is not available. When grid is available, the microgrid can supplement supply for peak load management
    • Important commercial buildings like airports, data centers, hospitals, etc. should be supported by microgrids
  • Speaking long term, microgrids are the most effective way to combat cyber attacks on our electricity grid. The US is moving ahead in this direction too.

Q4) What unique about Gram power developed Pre-paid smart meters? (Share info on technology, communication protocol, s/w analytics, and field results against some of known challenges with such meter deployment). How does it benchmark with other similar meters in market?

A)

  • Our meter has been developed keeping in mind the end consumer and application. Not as per what existing meters do or standards they comply with. We’re able to do the following with it:
    • Implement a prepaid payment model that does not require internet access for each and every home and that can be easily managed by low skilled local entrepreneurs
    • Provide real time consumption information for each meter with up to 30s intervals in a very reliable manner. We are able to do this because of our proprietary protocol that is light and takes into consideration the village geography and erratic connectivity
    • Automatically create an intelligent local wireless communication network that identifies and stops any kind of meter or distribution line tampering
    • Automatically operate different loads in the area based on their priorities. For example, in a grid-connected microgrid setting, we can program into our meters that when grid supply is not available and there is limited generation, then only the most important loads in the village must be operational
  • With our hardware and software, we provide an end-to-end solution for last mile power distribution management.

Q5) What economics and benefits of your company’s pre-paid meters to lets say a 1Lac customer base private utility for assume 100% adoption? Can you add how current pricing slabs for different consumer categories in your micro grid setup?

A)

  • If the average monthly consumption of power across the 1 Lac households is 150 kWh/month/home, and the commercial losses are over 40%, our meters pay back in less than 1 year. If the private utility or distribution franchisee works with us in a partnership model where the savings are shared over a longer period, the payback can become even quicker
  • Regarding pricing for consumers, our users pay between Rs.150-350/month to run a whole range of household appliances including small water pumps. A generalized capex number for microgrids will be difficult to suggest because the cost depends on a whole range of factors.

Q6) What customer behaviors you have seen supporting and opposing pre-paid meters? How you envisage developing airtel like pre-paid payment retail outlets to encourage wider adoption?

A)

  • Not a single consumer we’ve interacted with has opposed the prepaid meter. What customers don’t want though is the fixed monthly charges. They want a 100% pay-as-you-go model as that gives them full control of their expenses and ensures that they don’t feel cheated when the grid does not supply power to them. This model leads to a lot of energy conservation, which makes a lot of sense in a country like India where power is a scarce resource, and the coal and power sector is heavily subsidized

Q7) What supporting eco-system you think will help young companies like you for quick go-to-market?

A)

  • Openness of DISCOMs to execute pilots without tendering. Access to an advisory panel that can help us understand the nitty gritties of the laws and restrictions in the sector. Access to actual data on real loss levels.

The author can be reached at yashraj@grampower.com for more details. The company website can be viewed at: www.grampower.com

Solar Financial Modeling: 9 points you can’t afford to miss out

Solar Financial Modeling: 9 points you can’t afford to miss out

Any project related to power sector requires a huge amount of investment. Therefore, it is extremely necessary to make financial model and do a thorough analysis for the financial viability of the proposed project prior to any decision regarding the initiation of the project.

Financial Models can be complex and with various elements of Solar projects dependent on policy, financing, resource availability etc. modeling solar projects becomes a significantly complex process.

We, at pManifold, have been working with various project developers, investors and new market entrants involved in grid-scale (both Solar PV and CSP) and rooftop solar projects helping them understand the financials risks and returns of this opportunity. Based on that experience, we have identified 9 points that one should consider while developing a Solar Financial Model. These are,

1. Solar System Specifications

A good solar financial model should capture the technical and geographical information related to solar correctly. The parameters like solar insolation, solar degradation factor over 25 years, cell efficiency, DC-AC rerate factor, etc. plays an important part in defining the project cost and production capacity. This will impact project feasibility and decision making extensively.

2. Project Cost and Subsidies

In Solar PV projects, the Solar System is not the only project cost. The model should also account cost towards land, construction, power conditioning and evacuation systems, tracking systems, insurance, project management, pre-financial charges and more.

In recent years, the driving factor for adoption of solar projects is due to the financial support provided by Central and State Government in the form of subsidies. This should also be a part of the financial model.

Following is the snapshot of the project cost summary developed by pManifold’s financial analysts.

3. Financial Structuring

A large Solar PV project requires higher investment and for that the developer needs to opt for various financial products like fixed term loan, working capital loan, bank guarantee.  Hence, a part of the project cost needs to be funded through debt. This debt portion determines the company’s cost of capital and hence the Project IRR and Equity IRR. Financial model should capture debt cost, equity cost, loan period, interest rate and moratorium period.

4. Power Tariff

Power tariff rate is one of the most critical parameters which directly impacts project revenue and payback period. In Solar PV projects, feed in tariff rate and terms and conditions defined as per Power Purchase Agreement (PPA) is vital. The financial model should have the capability to tweak and customize the model to meet power agreements.

In the case of net metering, the consumer category, state and its tariff structure determines the potential saving a consumer can have. As power tariff varies significantly from state to state, hence, the ROI of solar rooftop projects varies across states.

5. Inflation

The typical financial model for Solar project, forecast is generally made for next 25 years. In this period, solar production decreases over time which impacts the project’s top line. In such case, inflation factors like tariff inflation and O&M inflation become key drivers of the model.

6. Accelerated Depreciation Benefit

The biggest advantage solar projects offer to the investor are tax savings. As per Section 32 of Income tax, an investor can claim 80% accelerated depreciation benefit in the first year and remain 20% in a subsequent year. Thus, the solar financial model should account depreciation schedule as per both Income Tax and Companies Act to assess project profitability and tax liability.

7. MAT & Tax Benefits

As per IT Rule, the Solar project developing companies like any other company are liable to pay Minimum Alternative Tax (MAT). A solar financial model should cover calculation of corporate tax, MAT, MAT credit available and MAT credit utilized over 25 years of project life cycle.

8. Scenario Analysis

A financial model is robust only if it has the capability to test different business cases simultaneously and then compare the results. A financial model should allow changing multiple input parameters to predict optimistic, pessimistic and average scenario at one go. A tool supported by good visualization and dashboard is a useful feature a management should look for. Here’s a quick snapshot of how we do it.

9. Assumptions

Financial models are built upon a certain set of assumptions. All assumptions should be documented and supported by references to ensure robustness of the model. Vetting by an independent certified professional is also recommended

Market Report on Input based Power Distribution Franchisee Market in India

Market Report on Input based Power Distribution Franchisee Market in India

Brief Summary

Power Distribution Franchisee – evolving Public Private Partnership (PPP) model has picked traction since 2009 after successful demonstration by Torrent Power Ltd. at Bhiwandi, Maharashtra, which got operational in 2007.

The licensee (state utility) appoints a private company on the basis of rationale bidding for distribution of electricity in a specified area for specified years of contract. This Distribution Franchisee model stands midway between licensee and full PPP model and is considered as one of the major energy reforms in power distribution sector that has the potential to turnaround the sector and take electricity to rural areas as well.

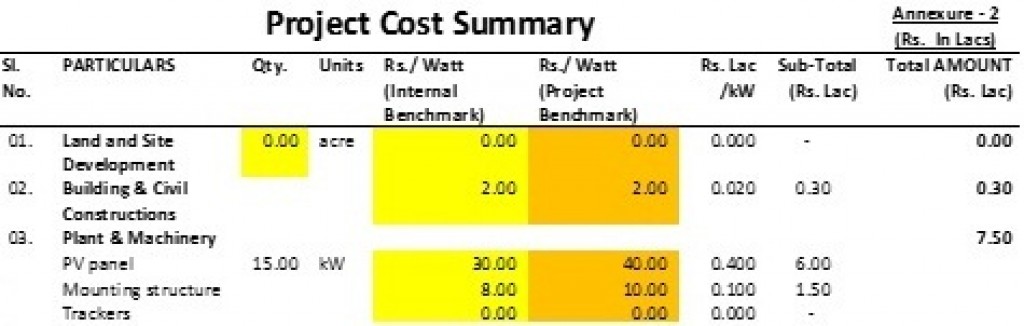
Out of the variants available, ‘Input based Distribution Franchisee’ model has recently seen an increase, currently with five cities across India, out of which distribution in three cities was handed over to private companies in 2011. Below shown is the indicative content of the report. Input based Distribution Franchisee, by far, has been mostly used operating model in urban areas.

Investments in this space are driven by the emerging nature of the ‘Input based Distribution Franchisee’ model which promises high returns, has low entry barriers, maintains proximity to end-consumers, involves high Capex with predictable cash flows and easy financial leverage when operating efficiently.

Various experts in power sector are of the opinion that in the coming 5 years, the Distribution Franchisee model is expected to grow manifold, thereby improving the power distribution scenario of the country.

pManifold’s Market Research Report on ‘Input based Power Distribution Franchisee’ in India provides an insights into the current scenario of Power Distribution Franchisee and potential future trends.

Detailed Table of Contents

  1. Terminology / Acronyms
  2. Executive Summary of Power Distribution Franchisee
  3. Power Distribution Scenario in India
    • Energy Value Chain & Leakages
    • Distribution Scenario
    • Why Utilities are making Losses?
    • Need for Reforms – Are the Issues with Utility Solvable?
    • What is the right model of Utility Privatization?
  4. Distribution Franchisee as a Business Model
    • Types of Business Models
    • Distribution Franchisee Segmentation and Applications
    • Why Distribution Franchisee model is attractive over other Privatization models?
  5. Input based Distribution Franchisee Market
    • Key Drivers
    • Distribution Franchisee Projects – Bid Won & Under Implementation
    • Model Uptake – Existing Operators
    • Competitive Landscape Assessment – Existing Operators
    • Future potential: Opportunities & Growth
    • Industry Analysis – Porters 5 Forces Model
  6. Operating Model
    • Stakeholders
    • Stakeholders Analysis
    • Typical Work Flow Map At Distribution Utility
    • Key Challenges With Distribution Franchisee Roll Out
    • Model Risks
  7. Bid Process and RFP Analysis
    • Bid Process
    • Evolution of RFPs
  8. Financial Model – Using Ujjain city as an example
    • Introducing the base Model for Investment Analysis
    • Assumed Capex Distribution
    • Estimated Returns from base model
    • Sensitivity to Input Bid Price
    • Sensitivity to Capex
    • Sensitivity to Opex
    • Sensitivity to Tariff Growth Rate
    • Sensitivity to Load Growth Rate
  9. Past Bid Analysis
    • Connections and Asset information from RFPs
    • Customer Segmentation
    • Winning Bid Comparison
  10. Case Studies
    • Bidding Analytics
    • Bhiwandi, BSES, NDPL
  11. Conclusions
  12. References
  13. Appendix
    • DF Tenders – New and Old Awaiting Decision
    • Suggested States for Distribution Franchisee Model by Shunglu Report
    • Lists of Distribution Companies, SEB’s in India
    • Recent Bid Analysis (Madhya Pradesh – Gwalior, Ujjain and Sagar)
      • MP Bids Quick Characterization
      • DF Attractiveness Matrix
      • Connections and Asset Information from RFPs
      • Customer Segmentation
    • Utility KPIs

Key Highlights of the Report are

  1. Current Market Scenario and Upcoming Opportunities of Distribution Franchisee
  2. Key Functional Roles and Responsibility of Distribution Franchisee Operator
  3. Key Roll Out Challenges for Distribution Franchisee Operator
  4. Case Studies of already existing Operators
  5. Competitive Landscape Assessment (CLA) of Distribution Franchisee Operator
  6. Financial numbers derived using a base financial model for UJJAIN
  7. Sensitivity to different parameters like CAPEX, OPEX, Tariff Rate, Load Growth Rate
  8. Bid process description for distribution franchisees

Key Questions Answered

  1. What is the potential of Distribution Franchisee model?
  2. Which states are looking to adopt the model?
  3. What are the key risks and challenges of the distribution franchisee model?
  4. How is the bid process and how to analyze information in the RFP?
  5. Typical Capex Distribution and Estimated Return?
  6. How is the experience of current distribution franchisee operators?
  7. How is the current competitive landscape in the distribution franchisee space?

Information Sources

  1. Excerpts from industry experts
  2. Opinions and Reviews of various reports in Distribution Franchisee sector
  3. Inputs from Conferences and Workshops
  4. Secondary Research

A Must Buy For

  1. Potential New Entrants in Distribution Franchisee space to get up-to speed on the market
  2. Existing Distribution Franchisee operators to train / update new hires and stay up to date on market trends
  3. Research and Educational Institutes to learn about various aspects of the Distribution Franchisee market
  4. Banks and Financial Institutions to learn about the sector and understand the financial implications of investing in distribution franchisee businesses
  5. Consultants to upgrade their know-how in the distribution franchisee market space

Pricing

Rs. 20,000/- (inclusive of taxes)

(Once payment is received, PDF copy of the report will be shared across email)

Payment
Payable to “pManifold Business Solutions Pvt. Ltd.”
IFSC : HDFC0001786
A/c No. – 17862320000109

Battery Recycling: Market Size, Recyclable Components, and Potential End-Use Applications

Introduction

With the projected demand for Li-ion batteries set to reach 235 gigawatt hours (GWh) by 2030, recycling has become a focal point. This emphasis aims to ensure a sustainable supply of raw materials for cells and decrease reliance on imported resources. Extracting materials through recycling Li-ion batteries is more sustainable than mining. Moreover, the limited availability of key battery materials like lithium, nickel, and cobalt further strengthens the case for recycling.

It was found that recycling has the potential to reduce primary demand compared to total demand in 2040, by approximately 25% for lithium, 35% for cobalt and nickel, and 55% for copper, based on projected demand. This creates an opportunity to significantly reduce the demand for new mining.[1]

Lithium Ion Batteries (LIBs) have multiple components that contain valuable metals and non-metallic materials that can be recovered during recycling. The materials recovered could be used to make new batteries, lowering manufacturing costs. Currently, those materials account for more than half of a battery’s cost. In many cases, batteries—especially in vehicles­—are retired from their first use but can be repurposed for secondary use, such as stationary storage. The prices of two common cathode metals, cobalt, and nickel, the most expensive components, have fluctuated substantially in recent years.

Market size: Global vs India

The global battery recycling market is valued at USD 26.9 billion in 2023 and is projected to reach USD 54.3 billion by 2030, growing at 10% CAGR during the forecast period.[2]

The figure above illustrates the cumulative demand projections from 2022-30 for lithium-ion batteries in India and the corresponding recycling volumes.

It is estimated that the cumulative potential of lithium-ion batteries in India from 2022-30 across all segments will be around 600 GWh (base case) and the recycling volume coming from the deployment of these batteries will be 128 GWh by 2030. Out of which almost 59 GWh will be from the electric vehicles segment alone.

Components of a Lithium-ion battery that can be recycled

  • Ion cells: These are the primary energy storage components of the battery. Recycling involves extracting materials like lithium, cobalt, nickel, and other metals from these cells. During the Preparation stage of recycling, the battery management system (BMS) containing the Li-ion cells is separated from the battery. Through further dismantling stages and treatments, various materials are recovered from the cells.
  • Cathode: Typically, the cathode contains materials like lithium cobalt oxide (LiCoO2), lithium manganese oxide (LiMn2O4), lithium iron phosphate (LiFePO4), or other metal oxides. It undergoes various steps during recycling including Washing, Filtering, Pressing and Drying. Consequently, the materials of the cathode can be utilised as active material for new cells.
  • Anode: Often made of graphite or other carbon-based materials. Recovering graphite and other materials from the anode is part of the recycling process. Anode scrap that comprises critical materials such as graphite and valuable Cu can be recycled and reintegrated into the battery supply chain. Recovering graphite from anode scraps can provide battery-grade graphite without energy-intensive purification processes and can help support a domestic supply chain. Like the cathode, the anode also undergoes similar steps (Washing, Filtering, Pressing and Drying) during recycling which allow the graphite to be recovered.
  • Electrolyte: Generally, the electrolyte is volatile and cannot be recycled. However, in certain frontier technologies for recycling such as Hydrometallurgy, electrolytes can be recycled as well. Recycling electrolytes requires the use of activated carbons which absorb the electrolyte vapours. There may also be the need for an inert gas environment due to the volatile nature of electrolytes.
  • Separator: A porous membrane that separates the cathode and anode, typically made of materials like polyethene or polypropylene. Removal of the separator is carried out during the Pre-treatment phase of recycling when the cells of the LIBs are Disassembled. The separator can then be recycled and reused.
  • Metal Foils: Thin foils of copper and aluminium are used as current collectors in the anode and cathode, respectively. They are separated from the anode and cathode during the process of Washing. These foils can then be recycled and the extracted Copper and Aluminium are used in the electrical industry.
  • Plastic and Metal casings: The outer casing of the battery is often made of plastic and/or metal. Both materials can be recycled. The casing is removed during the Preparation phase of the recycling process itself when the battery is discharged and dismantled.
  • Bus Bars and Terminals: These conductive components are used to connect the battery to electronic devices. They are often made of metals like copper or aluminium, which can be recycled. Like plastic and metal casings, the bus bars and terminals are separated during the Discharging and Dismantling (Preparation) phases of recycling.

The following chart shows the summary of materials that can be recovered through different recycling processes.

Use Cases of Recycled Battery

  • Usage in grid-connected solar panels: batteries that undergo damage during transportation and manufacturing cannot be used for their primary purpose i.e., EVs. However, they can be refurbished and recycled to yield battery packs to be used alongside solar panels
  • Usage in power banks: Laptop batteries can be repurposed and used for power bank applications.
  • Other industrially valuable materials :
    • Copper and aluminum extracted from batteries’ busbars find use in the electrical components industry
    • Nickel, Cobalt & Manganese are industrially valuable metals finding uses in the electrical, automotive, and housing industries.
    • Plastic extracted from the casings of the batteries also finds various industrial applications

References

More blogs on batteries and recycling-

Why Africa needs to focus on battery recyclingCan Metal-Air Batteries have the potential to revolutionise the automotive industry?

Driving Forward: Unravelling the Key to Electric Vehicle Success Through Technical Due Diligence

Introduction

In recent years, the global automotive industry has witnessed a paradigm shift with the rapid rise of electric vehicles (EVs). As nations worldwide commit to reducing carbon emissions and combating climate change, EVs have emerged as a pivotal solution towards a sustainable future. However, amidst this transformative journey, ensuring the success and longevity of the EV revolution demands meticulous attention to technical due diligence.

Growing Global Investments in EV Sector

Figure.1 Global Investments in EV Sector
  • In 2022, Venture Capital (VC) investments in early-stage battery technology start-ups increased by 15% to nearly USD 850 million
  • VC investments in vehicle and charging technology start-ups rose by 50% to USD 1.2 billion in 2022
  • Notably, the charging segment saw a record high in early-stage funding, reaching USD 730 million
  • Funding for battery recycling and reuse experienced an eightfold increase from 2021, reaching USD 200 million
  • From 2018 to 2022, China dominated VC investments in electric car start-ups, accounting for 70%. The United States led in investments for charging, trucks, and battery components during this period
  • Funding for battery manufacturing start-ups was evenly distributed across China, Europe, and the United States
  • India emerged as a significant player in the global EV VC space, particularly in two-wheelers, alongside China

Technical due diligence serves as the cornerstone of evaluating the feasibility, reliability, and safety of EV technologies and infrastructure.

  • Performance and Efficiency: Technical due diligence assesses the performance metrics and efficiency of EV components such as batteries, motors, and charging systems. This scrutiny ensures that EVs meet or exceed the performance benchmarks set by traditional internal combustion engine vehicles, thereby instilling confidence among consumers and investors.
  • Safety Standards Compliance: EVs involve intricate electrical systems and high-voltage components, necessitating adherence to rigorous safety standards. Technical due diligence verifies compliance with regulatory requirements and industry standards, mitigating risks associated with potential hazards such as battery fires or electrical malfunctions.
  • Supply Chain Resilience: The EV ecosystem relies on a complex global supply chain encompassing critical raw materials, components, and manufacturing processes. Thorough technical due diligence evaluates the robustness and resilience of the supply chain, identifying vulnerabilities and mitigating supply chain risks to ensure uninterrupted production and distribution of EVs.
  • Innovation and Technology Integration: EVs continue to evolve with advancements in battery technology, autonomous driving capabilities, and vehicle-to-grid integration. Technical due diligence facilitates the assessment of emerging technologies, and the evaluation of their feasibility, scalability, and compatibility with existing EV platforms.
  • Infrastructure Development: The widespread adoption of EVs hinges upon the availability of robust charging infrastructure. Technical due diligence scrutinizes the design, implementation, and scalability of charging networks, ensuring seamless integration with grid infrastructure and optimizing charging efficiency.
  • Investment Decision-Making: For investors and stakeholders, technical due diligence provides invaluable insights into the viability and potential risks associated with EV projects. By conducting comprehensive assessments of technological, operational, and financial aspects, due diligence enables informed investment decisions, thereby fostering confidence and accelerating the flow of capital into the EV sector.

“The essence of technical due diligence lies in uncovering the hidden intricacies of technology, illuminating the path towards innovation, resilience, and sustainable growth.”Vikrant Vaidya, Senior Partner, pManifold Group

pManifold works extensively in the eMobility sector providing technical due diligence support enhancing investment impact, market positioning, and development efficiency for various stakeholders as shown below:

Read more pManifold on technical due diligence –

Importance of ‘Measurements based’ Technical Due Diligence
Leveraging Customer Perspective for a stronger Onsite, Local Due-Diligence in Pre-Bid phase

Eco-Farm Innovation: PURE Appliances Drive Sustainable Agriculture in India

Introduction

India, as an agrarian nation, is witnessing a transformative shift in its agricultural landscape with the integration of renewable energy and productive use appliances. In the pursuit of sustainable practices, the adoption of clean energy solutions plays a pivotal role in enhancing agricultural productivity, reducing dependency on traditional power sources, and mitigating environmental impact. In this blog let us explore the significant impact of renewables and productive use appliances on sustainable agriculture in India, supported by compelling statistics.

India’s commitment to renewable energy is evident in its ambitious targets and policies. According to recent statistics, India is among the top countries globally in terms of renewable energy capacity. As of October 2023, the country has 178.98 GW of installed renewable energy capacity, comprising solar, wind, and other sources. This shift towards clean energy aligns with the goal of ensuring energy security and minimizing the carbon footprint associated with traditional agricultural practices.

The integration of productive use appliances, powered by renewable energy, brings about a paradigm shift in agriculture. The key PURE appliances including solar pumps and solar cold storage units are becoming instrumental in enhancing productivity, reducing post-harvest losses, and improving overall efficiency in the agricultural value chain.

Solar Water Pumps: Harnessing abundant sunlight, solar water pumps offer a cost-effective and eco-friendly alternative to traditional energy sources. As per recent statistics 5.5. million SWPs are installed in India, benefiting thousands of farmers and enhancing agricultural productivity. This transformative shift not only reduces dependence on conventional energy but also positively impacts the livelihoods of farmers, particularly in remote areas with limited access to power infrastructure.

Figure 1. SWPs installed by State in India (Source: Statista)

Solar Cold Storage: As per FAO, almost 40% of the fresh fruits and vegetables worth 8.3 billion are lost as post-harvest losses, a longstanding challenge in Indian agriculture. The implementation of solar-powered cold storage units emerges as a promising solution as it not only ensures better income for farmers but also contributes to food security on a larger scale. However, certain challenges like high cost and market linkages need to be addressed to achieve their full potential.

“We urgently need to accelerate the build-up of solar energy, especially in developing countries and in applications that influence the daily lives of those without access to reliable energy – such as getting electricity from solar mini-grids, powering agricultural pumps, and running cold storages.”Director General of International Solar Alliance, Dr. Ajay Mathur at the 6th Session of ISA at New Delhi

The statistics presented underscore the transformative potential of renewables and productive use appliances in Indian agriculture. As the nation strives for sustainable development, the continued adoption of clean energy solutions holds the key to ensuring food security, increasing farmers’ income, and mitigating the environmental impact of traditional farming practices. The power of renewables is not just in generating electricity; it’s in cultivating a greener, more sustainable future for India’s agriculture.

Made in India EVs poised for Global Market Developments

xr:d:DAF8AX6E9gE:2,j:5061337900247736132,t:24020609

India, with its robust economic growth, is emerging as a pivotal global player across various sectors, including the transportation sector. The nation has set an ambitious target of achieving net-zero emissions by 2070. To achieve this goal, an important step involves the decarbonization of the transportation sector, with a specific focus on transitioning to electric vehicles (EVs) to mitigate Greenhouse Gas (GHG) emissions. There are ambitious targets set to increase the share of EV sales to 30% in private cars, 70% in commercial vehicles, 40% in buses, and 80% in two-wheelers and three-wheelers by 2030. In absolute numbers, this is estimated to translate into an impressive target of 80 million EVs on Indian roads by 2030.

The Indian automotive market is expected to be the third-largest by 2030, considering volume, underscores the anticipated growth and significance of the industry on a global scale. The strategic transition to EVs in India comes with diverse advantages. The country possesses a pool of skilled manpower in the technology and manufacturing sectors, established industry players, and new stakeholders exploring multiple pathways to R&D and commercial production of vehicles and auto components. This transformation is geared towards meeting the increasing EV demands both domestically and globally. According to an independent study by the CEEW Centre for Energy Finance (CEEW-CEF), the EV market in India will be a US$206 billion opportunity by 2030 if India maintains steady progress to meet its ambitious 2030 target. This would require a cumulative investment of around US$175 billion in vehicle production.

Policy Backing for Indigenous Manufacturing

The Indian government has approved initiatives like the Production Linked Incentive (PLI)scheme for the Auto and the Auto Component to drive and enhance local production capabilities and achieve its goal. This scheme intends to incentivize high-value advanced automotive technology vehicles and products, including ‘green automotive manufacturing’.It is open to existing automotive companies as well as new investors who are currently not in the automobile or auto component manufacturing business. It comprises two main components:

  1. Champion OEM Incentive Scheme: This is a ‘sales value linked’ scheme, applicable to battery electric vehicles, and hydrogen fuel cell vehicles of all segments.
  2. Component Champion Incentive Scheme: This is a ‘sales value linked’ scheme, applicable to advanced automotive technology components of vehicles, completely knocked down (CKD)/ semi knocked down (SKD) kits, vehicle aggregates of 2-wheelers, 3-wheelers, passenger vehicles, commercial vehicles, and tractors, etc.

The scheme has been successful in attracting a proposed investment of ₹ 74,850 crore (USD ~9 billion) against the target estimate of investment of ₹ 42,500 crore (USD ~5 billion)over a period of five years. The proposed investment of ₹ 45,016 crore (USD ~5 billion) is from approved applicants under Champion OEM Incentive Scheme and ₹ 29,834 (USD 3.5 billion) crore from approved applicants under Component Champion Incentive Scheme[1].

This PLI Scheme for the automotive sector along with the already launched PLI scheme for Advanced Chemistry Cell with a budget outlay of ₹18,100 crore (USD 2.1 billion) and Faster Adaption of Manufacturing of Electric Vehicles (FAME) Scheme of ₹10,000 crore(USD 1.2 billion) will give a big boost to manufacturing of EVs in India.

Growing EV Market and Industry Commitments

In the first nine months of 2023, the sale of passenger EV cars in the country surged to 75,000, more than doubling the volume from the same period the previous year. Notably, 86% of all-electric cars sold this year were priced under $20,000. Several new models were introduced, including the most economical one, MG’s Comet mini car, retailing for less than $10,000. Tata Motors’ popular Tiago compact EV, priced around $10,500, accounted for 39% of EV shipments[2].

[1]India’s EV Market Takes-off

[2]Ministry of Heavy Industries, Press Release

xr:d:DAF8Aj7Hnt4:2,j:8440163528874454673,t:24020610

India exported on average over half a million cars over the past 5 years[3]. According to industry insiders, exports from India are poised to surpass the annual threshold of ~1 million units within the next four to five years. During this period, it is anticipated that EV exports will constitute 25-30 percent of all vehicles shipped from the country, despite domestic EV penetration possibly reaching only 10-15 percent.

The surge in demand and the growing EV market has prompted commitments from automakers to enhance local EV production. According to data from BloombergNEF, these companies have pledged nearly $5.4 billion in investments to establish new or expand existing EV manufacturing facilities in India. These include commitments not only by domestic companies such as Tata Motors and Mahindra & Mahindra but also by Korean automakers Hyundai and Kia. The other notable developments from prominent automakers in this sector are as follows:

  • Maruti Suzuki plans to produce over 2.5 lakh units of EVs by 2027, of which almost 60-70 percent will be exported to key global markets including Japan
  • Honda Cars India, in preparation for its upcoming EV based on the new mid-size SUV platform, is internally developing a project called Asian Compact Electric (ACE-EV). Anticipated to commence in 2026-2027, the automaker aims to export approximately 30,000-50,000 units of its EVs to Japan and other global markets.
  • Vietnamese EV start-upVinFast has recently disclosed its intentions to establish an EV manufacturing facility in India by 2026, with an overall investment of USD 2 billion (over ₹16,000 crore)

[3]Car Exports in last 5 years

To support this capacity expansion, the government plans to provide subsidies, aligning with its broader initiatives to decrease India’s dependence on imports for EV components. The government is considering reducing import duties on fully assembled units for companies like Tesla in the initial stages. A policy framework is also in the works for technologically advanced vehicle manufacturers, mandating local sourcing. The import duty on green/eco-friendly vehicles may be significantly lowered, potentially from 100 percent to 15-30 percent[4], with the condition that Indian carmakers initiate local production and source components locally. Furthermore, the government will seek assurances from these companies regarding the development of a supplier ecosystem, with an initial requirement of sourcing about 20 percent of the parts locally within the first two years. This percentage is expected to increase to 40 percent by the fourth year of the agreement.

In addition to vehicle manufacturing commitments, local battery plants have also expanded, supported in part by government subsidies. Companies including Tata Group, Amara Raja, Exide Industries, and Ola Electric – all local players – have announced a total of 12.6 gigawatt-hours of cell manufacturing capacity. More announcements are expected in the coming months once the government awards the remaining capacity under its aid program.

It is evident that India is embarking on the next stage of its automotive evolution. The Indian government has declared its commitment to establishing the country as a robust hub for EV domestic and export needs, supported by proactive policies. This intention is swiftly transforming into tangible actions on the ground, prompting national as well as global vehicle manufacturers to make pivotal commitments. This trajectory positions India as a formidable contender in the global EV competition.

(Views are personal, consolidated from various sources including articles, blogs, etc.)

[4]EV Sector in India: Production Capacity, Government Targets, and Market Performance

Carbon Markets, Types, and Leading Initiatives in Clean Transport

xr:d:DAF6x1U_1n4:2,j:7328898966654900584,t:24012407

The concept of voluntary carbon markets has been around for decades, gaining more recognition among climate activists than among leaders in politics and the financial community. The Kyoto Protocol in 1997 marked the initial phase where international involvement in carbon markets began to see broader acceptance with more than 150 nation signatories.

The world has evolved considerably, recognizing climate action as an urgent step to restore and rehabilitate the planet. Offsetting emissions plays an important role as a supplementary strategy in the decarbonization efforts of numerous companies, particularly addressing residual emissions in challenging-to-abate sectors (steel, cement, thermal power plants, etc)

Carbon markets represent a key tool in addressing the challenge of climate change, which involves reducing the accumulation of greenhouse gases (GHG) in the atmosphere. The participation of Designated Consumers (DC) in compliance with the Perform, Achieve, and Trade (PAT) scheme has brought the spotlight to this approach in India, making it a topic of discussion and consideration among others.

A carbon credit serves as an offset mechanism issued for an equivalent reduction or absorption of carbon emissions from the atmosphere, resulting from a targeted carbon reduction project. These are issued to anyone aiming to reduce their carbon footprint.

“1 carbon credit = 1 tonne of CO2”

Carbon markets on the other hand are trading systems in which carbon credits are sold and bought. Companies or individuals can use carbon markets to compensate for their GHG emissions by purchasing carbon credits from entities that remove or reduce GHG emissions. To get a better view, one tradable carbon credit equals one tonne of carbon dioxide or the equivalent amount of a different greenhouse gas reduced, sequestered or avoided. When a credit is used to reduce, sequester, or avoid emissions, it becomes an offset and is no longer tradable.

“Issued carbon credits are certified and verified emissions reductions available for sale, listed on carbon registries. Retired carbon credits, once purchased, can no longer be traded, or bought by any entity, with some being bought to retire later.”

Methane is a highly potent greenhouse gas with a global warming potential of 25 times that of carbon dioxide.  Thus, the reduction of one ton of methane is equivalent to 25 tons of carbon dioxide.

One metric ton of Methane avoided is equivalent to 25 carbon credits[1]

Growing consumer pressure and the introduction of mandatory emissions trading programs have compelled companies to explore the voluntary carbon offset market. In the context of international regulations, there is an increasing necessity for companies and investors to enhance their understanding of carbon credits. Additionally, a carbon market facilitates the simultaneous trading of both carbon credits and carbon offsets for investors and corporations.

[1]https://carboncredits.com/carbon-prices-methane/#:~:text=LNG%20produces%20methane%20gas%20which,the%20equivalent%20emissions%20as%20CO2.

A Brief History of Carbon Markets

The concept of voluntary carbon markets has been around for decades, gaining more recognition among climate activists than among leaders in politics and the financial community.

The Kyoto Protocol in 1997 marked the initial phase where international involvement in carbon markets began to see broader acceptance with more than 150 nations as signatories. Parties with commitments under the agreement agreed to limit or reduce their greenhouse gas emissions between 2008 – 2012 to 5.4% which was well below the levels of 1990. Emissions trading, as set out in the Kyoto Protocol, allowed countries to sell the excess capacity of emission units to countries that had levels well over their targets.[2]

The Protocol also laid the foundation and groundwork for Market-Based Instruments (MBIs), including the Clean Development Mechanism (CDM). This mechanism enabled countries with emission reduction commitments to undertake or finance projects in the developing world, earning tradable certified emission reduction (CER) credits to achieve Kyoto targets.

It is since then almost the entire world – both developed and developing countries started formulating carbon emissions standards and guidelines for controlling harmful gas emissions.

At present, carbon markets are undergoing big changes due to the implementation of international governmental cooperation for exchanging emission reductions. This cooperation is being implemented under Article 6 of the Paris Agreement enabling countries to voluntarily work together to fulfill emission reduction targets outlined in their Nationally Determined Contributions (NDCs).

Types: Mandatory and Voluntary

They are broadly divided into two types of carbon markets –compliance and voluntary.

xr:d:DAF6x1U_1n4:3,j:2568594160955983511,t:24012407

[2]https://timesofindia.indiatimes.com/blogs/voices/the-carbon-credits-market-the-past-present-and-future/

Compliance markets are created as a result of any national, regional, and/or international policy or regulatory mandates, with global agreements like the Kyoto Protocol or the Paris Climate Change Accord establishing the limits. These markets are instituted and overseen by obligatory national, regional, or international carbon reduction frameworks.

To enable the countries to take steps to lower their emissions can be achieved either by implementing a carbon tax or establishing a compulsory carbon market. The central components of these markets are referred to as Compliance Emission Reduction (CER) credits.

Examples of mandatory carbon markets: the European Union Emission Trading System (EU ETS), the Western Climate Initiative (WCI) & the Regional Greenhouse Gas Initiative (RGGI)

Voluntary carbon markets, both at the national and international levels, involve the issuance, purchase, and sale of carbon credits voluntarily. In these markets, companies and other entities proactively take actions to reduce their carbon footprint as part of their initiatives, driven by considerations like corporate social responsibility (CSR).

Voluntary markets operate independently of compliance markets, allowing companies and individuals to voluntarily purchase carbon offsets without any specific intention for compliance purposes. Voluntary carbon markets can also accelerate emission reduction efforts toward net zero and gain increasing interest from the private sector.

In simple words, the regulatory market is mandated, while the voluntary market is optional.

xr:d:DAF6x1U_1n4:4,j:4758469480388845605,t:24012407

Source: Berkeley Carbon Trading Project

India is poised to introduce its country-level carbon market. The Carbon Credit Trading Scheme(CCTS) in the Indian Carbon Market (ICM) will enhance the energy transition efforts with an increased scope that will cover the potential energy-intensive sectors in India. For these sectors, GHG emissions intensity benchmarks and targets will be developed, which will be aligned with India’s emissions trajectory as per climate goals. It is envisaged that there will be a development of a voluntary mechanism concurrently, to encourage GHG reduction from non-obligated sectors.

Carbon credits from e-Mobility are an overlooked (potentially massive) contributor to implementing net-zero strategies.

Transport accounts for a quarter of global emissions, about 12 billion tCO2e/year, with road transport responsible for 70% of this figure. Despite the global commitment to achieving zero-emission targets by 2030-2050, there’s an increasing need for climate mitigation in both the energy and transport sectors. [3]

While carbon credits from renewable energy are prevalent, those from the transport sector are notably lacking. Electric mobility (e-Mobility) emerges as a pivotal solution, replacing fossil fuels with electricity and optimizing renewable energy use. E-Mobility presents a crucial opportunity to decarbonize both sectors. Despite the significant transport has on climate, the sector remains the most underrepresented in carbon finance, contributing less than 2% of the global carbon credits.

Battery EV technologies hold promise to change this landscape by expediting the generation of carbon credits from transport, raising awareness, and stimulating demand for such credits. Carbon finance mechanisms can potentially help project proponents overcome some key financial barriers, like high vehicle costs and a lack of charging infrastructure, by providing a financial reward for avoided emissions.

While compared to developed markets like the US, the Indian Carbon market is still in its initial stages, its CDM projects have helped India in developing projects that qualify for voluntary carbon credits.

[3]https://shellfoundation.org/app/uploads/2021/11/SouthPole-report.pdf

xr:d:DAF6x1U_1n4:5,j:4552429794347544191,t:24012407

Bangkok E-Bus Programme

Switzerland and Thailand are currently implementing the first e-Mobility project under Article 6,[4] focusing on acquiring internationally transferred mitigation outcomes (ITMOs). The initiative, known as the Bangkok E-Bus Programme, targets the introduction of around 2,000 electric buses in the Bangkok Metropolitan Area. This strategic move aims to avoid approximately 500,000 tonnes of CO2 by 2030, offering a substantial contribution to air quality improvement in the congested megacity of Bangkok.

The program was commissioned by the KliK Foundation and is being implemented by South Pole, in partnership with the Thai company Energy Absolute.

Since November 2022, Switzerland has approved three offset programs. Two of these programs, developed by the United Nations Development Programme (UNDP), aim to reduce methane emissions from rice farming in Ghana and promote the use of decentralized mini-solar panels on outlying islands in Vanuatu. These initiatives align with the federal administration’s voluntary carbon offsetting efforts.

[4]https://www.alliancesud.ch/en/new-electric-buses-bangkok-no-substitute-climate-protection-switzerland

Article 6 of the Paris Agreement enables countries to collaborate voluntarily by transferring carbon credits to help each other achieve emission reduction targets. Specifically, 6.2 allows trading in GHG emission reductions, 6.4 establishes a supervised mechanism like the Kyoto Protocol, and 6.8 recognizes non-market approaches for cooperation without emission reduction trading.

India and Africa’s Leap Towards Sustainable Mobility through Retrofitment

Retrofitting Electric Vehicles (EVs) presents a compelling opportunity to accelerate the transition towards sustainable transportation worldwide. Globally, as countries set ambitious targets for reducing carbon emissions, retrofitting offers a viable solution to upgrade existing internal combustion engine vehicles. It not only extends the lifespan of these vehicles but also significantly reduces their environmental impact.

However, challenges persist, such as ensuring compatibility with diverse vehicle models, optimizing battery technology, and addressing regulatory standards. Additionally, the cost-effectiveness of retrofitting compared to purchasing new EVs remains a critical consideration. In Africa, retrofitting holds immense promise, particularly in regions heavily reliant on older, polluting vehicles. The continent faces unique challenges, including limited access to charging infrastructure and a diverse vehicle fleet. Retrofitting offers an opportunity to bridge this gap by transforming conventional vehicles into cleaner, more efficient alternatives. By leveraging local expertise and resources, Africa can potentially lead in the adoption of retrofitting technologies, fostering economic growth and environmental sustainability.

In India, with a burgeoning automotive market and a rapidly expanding EV sector, retrofitting assumes strategic importance. It provides a practical approach to make the existing fleet more eco-friendly, especially in a country with a substantial number of older vehicles. Moreover, retrofitting aligns with India’s emphasis on ‘Make in India’ initiatives, spurring innovation and employment opportunities in the EV ecosystem. However, ensuring safety standards, establishing reliable battery disposal mechanisms, and creating robust regulatory frameworks will be essential to unlock the full potential of EV retrofitting in the Indian context.

pManifold organized a webinar on the topic “ Understanding Opportunities and Challenges in Retrofitting EVs” and to get a better understanding of the topic webinar had Stephan Lacock, Mechatronic engineer from the University of Stellanbosch, Rani Srinivasan – founder and CEO of Zero21 Renewable Energy Solutions and Vikrant Vaidya – partner and lead of EV systems engineering, pManifold.

The webinar focused on:

  • Understanding the business case for EV retro-fitment and the associated challenges and opportunities (India & Africa)
  • Understanding technical challenges and mitigation measures in EV retro-fitment to ensure reliability and safety (India & Africa)
  • Overview of the existing regulatory support to navigate the challenges and drive widespread adoption

Stephan Lacock, mechanical engineer from Stellenbosch University, highlighted current transport and vehicle-related trends in South Africa, revealing that South Africa exports 63% of locally manufactured vehicles, with 70% going to Europe, contributing around 4.3% to South Africa’s GDP. However, the impending 2035 deadline in Europe to stop selling internal combustion engine vehicles poses a risk to approximately 500,000 local jobs. Stephan also stressed the importance of skill development, carbon emissions reduction, and affordability for a successful transition to electric vehicles

xr:d:DAF5S2HGYSU:2,j:5928277849896221144,t:24010811

Giving an overview of the five-year study exploring the feasibility of retrofitting public transportation vehicles in Sub-Saharan Africa, Stephan highlighted retrofitting existing vehicles as a cost-effective solution compared to local manufacturing of Sub-Saharan Africa-specific electric vehicles. Although retrofitting costs are initially higher, scaling the process can reduce costs by large, making the transition much more affordable. Stephan showcased a prototype of a retrofitted a 65-seater bus and a small pick-up truck and emphasized on the Golden Rule for retrofitting – Strive to maintain the vehicle as close as possible to its original physical condition and behavior

The webinar also discussed challenges in electrification in countries like India. Rani Srinivasan – founder and CEO of Zero21-Renewable Energy Solutions who has deployed ICAT-authorised conversion kits, highlighted conversion kits as a \viable solution to accelerate EV adoption especially three-wheelers, with reduced environmental impact of mass manufacturing. He also emphasized the challenges for retrofitting which include the absence of a robust scrap policy, lack of specific standards for retrofitting, issues with vehicle uniformity to fit the conversion kit, and scalability.

Rani also highlighted that policy measures such as reduced GST and provision of financing for the new vehicles are impacting conversion kits uptake. He advocated the need for conversion over scrapping which addresses most of the financial, environmental, and logistical concerns, presenting retrofitting as a viable solution for the large-scale conversion of three-wheelers in India. Additionally, education and awareness efforts need to be focused on promoting the adoption of the conversion kits.

On the other hand, Lacock discussed financing challenges in retrofitting in South Africa and acknowledged that despite incentive programs by government entities and development banks in Sub-Saharan Africa, there is hesitancy due to perceived complexity and high costs. While technology is ready, convincing funders to support retrofitting projects is hindered by the need for ground data and tracking to prove the vehicle’s lifespan.

Lastly, speakers emphasized the importance of safety measures in retrofitting especially in the context of batteries and the need for compliance with regulatory standards. Both speakers highlighted the necessity of proper training and education to address safety concerns in the retrofitting process.

https://youtube.com/watch?v=5JOklcqcWlE%3Ffeature%3Doembed