This is a consolidation of our previous blogs, focussed more to help the current bidders for Madhya Pradesh DF bids.
Bidders Perspective
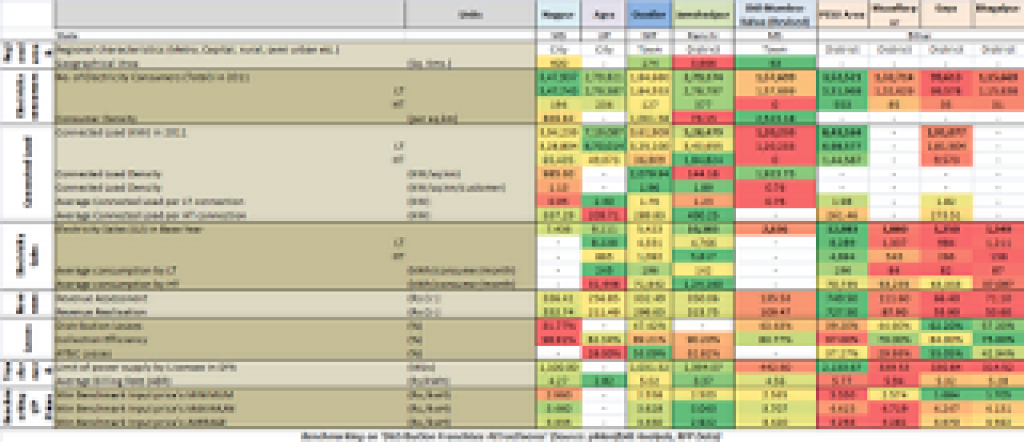
- Baseline: Key comparison of revised RFPs for MP Distribution Franchisee
- Selection: Distribution Franchisee Attractiveness – Comparison for Madhya Pradesh’s9 districts
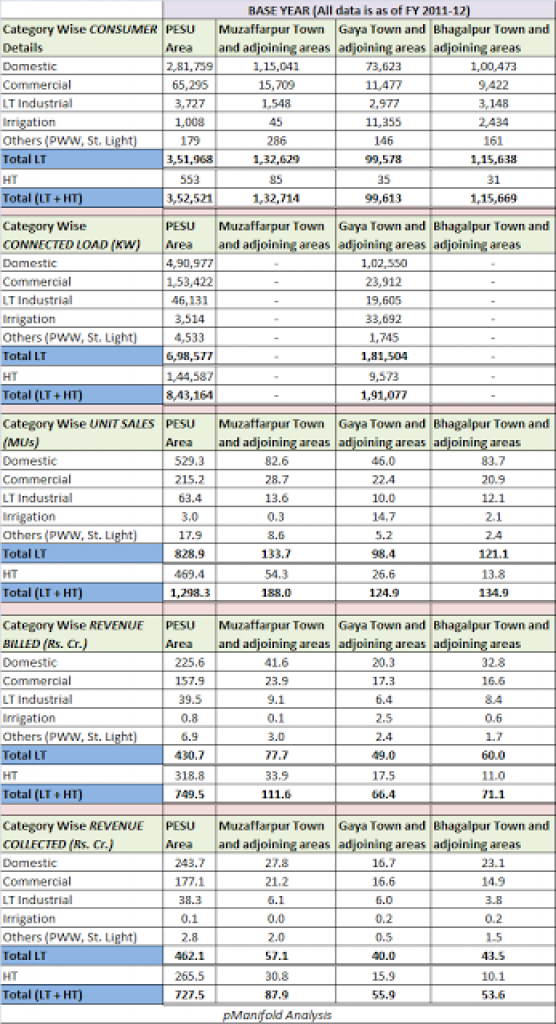
- Customer mix: Customer segmentation and analytics of revised MP Distribution Franchisee bids
- Input price: Bid analytics for MP Distribution Franchisee
- Viability: Urban & Rural customer segmentation in revised Distribution Franchisee bids at MP
Utility and Regulators perspective
- Baseline accuracy & trust: Third Pre-bid Conference take-away from Madhya Pradesh Distribution Franchisee Bids
- Customer Satisfaction is key: Pre-Bid conference take-away from Madhya Pradesh Distribution Franchisee bids
- Utility gains: Real gains for Utility and End-Consumers from Distribution Franchisee business
- Large theft: Local Insights on Gwalior City – Field interview with utility ground staff
- Capacity Building: R-APDRP: Missing understanding on usability of technology by utility people
Customer perspective
- Quality of service: Why Customer’s Satisfaction & Preferences are important for Electricity Utilities?
- On-site Due-dilligence: Leveraging Customer Perspective for a stronger Onsite, Local Due-Diligence in Pre-Bid phase
- Resistance to privatization: Three key comparative findings from Customer Survey Results of Gwalior, Datia& Bhind
- Expectations from Utility: Comparative findings from Customer Satisfaction Survey of Sagar, Satna& Narsinghpurdistricts of MP
- Price & Communications: Key Comparative findings from Customer Satisfaction Survey of Shajapur, Ujjain & Dewasdistricts of MP
Distribution Model perspective
- Lack of good baseline data & reporting leads to irrational Power Franchisee bidding
- Change Management: Challenges with scaling Power DF Model
- Performance Monitoring: Key Performance Indicators (KPIs) for Distribution Utility
- Rural Franchisee innovation: Rural Franchisees – Could they become pilot ground to raise next level of Distribution services?
- Analytics: Impact that could come from Utility Measurements, Analytics and Monitoring
Also pManifold organised a workshop Utility Monitoring and Power Distribution Franchisee: Enhancing SEB’s Performance
Also we have detailed local intelligence reports on customer opinion, preferences and satisfaction for distribution utilities for the 3 towns of Gwalior, Ujjain and Sagar. The results are presented using intuitive GIS maps at town level to give localization of 28+ power and service quality attributes. This will allow bidders to get increased ROI from their on-site technical due-diligence by pointing location specific key areas of concerns for power delivery services and also better estimate/validate the required capex and opex. Each site comprehensive report is priced at Rs. 25K only. A consolidated 3 towns top level comparison report is also available at the same price. (See report sample)
Post by: Rahul Bagdia @ pManifold