The Ministry of Power’s financial restructuring plan has made the introduction of private participation in distribution as one of the mandatory conditions for availing the benefits of scheme (as a result of high AT&C losses, low IT involvement and huge financial losses). Whilst State Governments’ (except Delhi and Odisha) have not undertaken privatisation of Discoms, Distribution Franchisee (DF) model has emerged as one of the attractive options to involve private players for enhancing distribution operations.
The success of Torrent Power as a DF player in Bhiwandi in Maharashtra has fuelled the other states to adopt this model. Other operational areas include Agra (UP), Nagpur (Maharashtra), Aurangabad (Maharashtra), Jalgaon (Maharashtra) and Sagar (MP).
Currently, utilities are going for Input and Investment-based Franchise Model, under which Franchise takes the responsibilities for power supply to customers, collection of revenue, management, upgradation and expansion of distribution infrastructure.
The licensees’ functions are limited to power supply at input points and keeping a check of regulatory interface. Lately new DF models are emerging like Input-based Franchise with Incremental Revenue sharing (IBF-IRS). Generally, zones with high consumption and transmission and distribution (T&D) losses are given to the franchise.
A brief outline on different types of DF model based on 3 states Odisha, Jharkhand and Bihar are mentioned below:
Odisha DF
The Central Electricity Supply Utility of Odisha (CESU) has adopted the IBF-IRS model for franchising areas. Under this model, the incremental revenue realized beyond the baseline revenue per unit (RPU) is shared between the DF and CESU at a pre-defined ratio. Penalty is imposed for not realizing the base RPU on the DF and it is revised every year based on the tariff indexation formula.
In IBF-IRS, the input energy is free of cost in order to alleviate the demand and price fluctuation-related risks. The IBF-IRS is only for five years and all assets below the distribution transformer (DT) are too maintained by the IBF-IRS DF. Also, the IBF-IRS DF mandates the installation of smart meters and partial Capex on the meters is to be recovered by 40 months through monthly meter rent.
CESU allotted 15 divisions with 1.3 million customers accounting for 77% of utility’s customer base with AT&C losses ranging from 51% to 72%. These franchises are awarded to Enzen Global Solutions Private Ltd., Feedback Electricity Distribution Company Ltd (FEDCO), River Side Utilities Pvt. Ltd. And Sea Side Utilities Pvt. Ltd. with the responsibilities of distribution-related activities and the task of reducing AT&C losses by 15% over a period of 5 years.
In Feb 2013, FEDCO commenced operations as a franchisee in Puri, Khorda, Balugaon and Nayagad divisions in Odisha across an area of 9,000 sq. km. (covering 4,00,000 consumers). The company has taken several steps to improve distribution operation and minimise AT&C losses, like setting up customer care center, spot collection, developing ERP for billing, etc. These steps resulted in increasing the billing coverage to 88% from 75%, collection coverage improved to 70% from 56%, AT&C losses reduced to 54% from 61%.
Jharkhand DF
Jharkhand State Electricity Board (JSEB) adopted Input-based DF model in Jamshedpur and Ranchi and were awarded to TATA Power and CESC LTD respectively. Ranchi circle covered 257,000 consumers, AT&C losses stood at 42% required to be reduced to 9% over the next 15 years. The key feature of Ranchi DF agreement is the provision of an independent audit for baseline, which is important as often the asset and loss figures stated by state electricity boards are not accurate. E&Y is about to complete such an audit in Ranchi.
Bihar DF
The recently unbundled distribution utilities in Bihar have taken steps to improve operations through appointment of franchisees. While North Bihar Power Distribution Company Limited (NBPDCL) has appointed Essel Vidyut Vitaran Ltd. as a DF operator for Muzaffapur, South Bihar Power Distribution Company Limited (SBPDCL) has appointed India Power Corporation Ltd. (formerly DPSC limited) for Gaya and SMPL Infra Ltd. for Bhagalpur.
India Power will serve over 1,00,000 consumers. The franchise area had registered energy sales of 125 MUs and T&D losses of 62% during the base year. The company has planned to invest 330 million in the first five years to improve distribution operations by investing in meter replacement, consumer indexing, installation of billing systems etc.
The Way Forward
To ensure success of the franchise model between licensee and franchisee, it is important to implement an effective monitoring process. Some modifications are required in the franchisee framework, especially in provisions related to regulatory monitoring, loss reduction and consumer benefits, Capex investment and supply guarantees by the licensee.
Please note: Above is the summary of the recent article on Power Distribution Franchisee model published in PowerLine magazine, Feb 2014.
India and most developing countries continue to struggle for 24×7 power supply, good Power Quality (PQ) environment, and Energy Efficient (EE) economy. See APQI earlier blog that tries to quantify economic impact from poor PQ environment – Are developing economies at risk due to power quality issues and challenges?
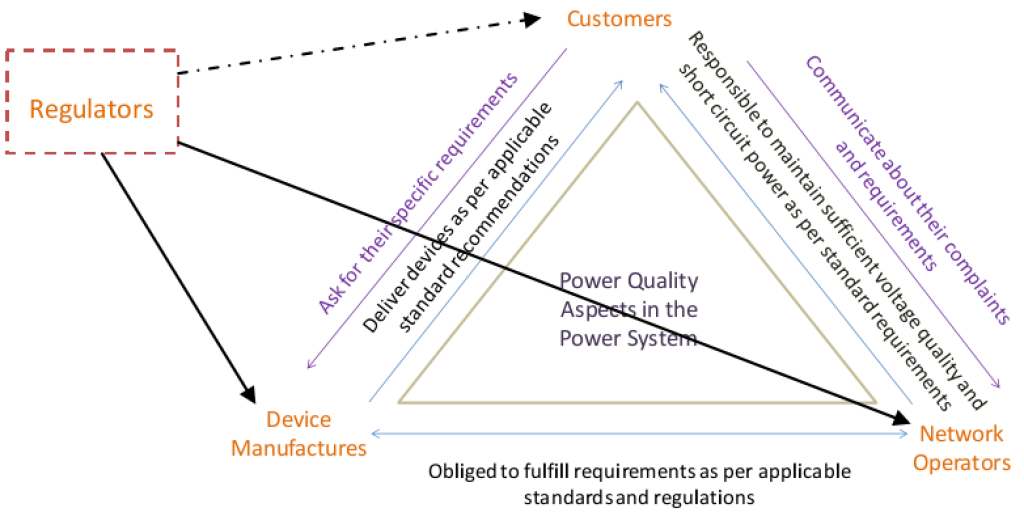
Another follow-up question will be WHO IS RESPONSIBLE FOR MAINTAINING GOOD POWER QUALITY? Answer to this is usually divided and depends upon whom we pose this question. Network Operator will blame his end-customers, Device Manufacturer will blame both the Network Operator and the end-customer, and end-customer usually has not much awareness, and believe that its supply problem from Network Operator.
In addition to above 3 key stakeholders, there are others like – Designers, Commissioning Engineers and Maintenance Engineers that also plays role in sustaining good PQ environment.Commissioning Engineer play the role in ensuring the quality of installation based on certain design standards.
Good installation is one of the necessities to maintain power quality during operations and to minimize voltage drop, sparking, overheating, etc. Maintenance engineers are subsequently responsible for preventing any glitches in operations which can result in power quality issue. For ex. loose connections lead to sparking;poor quality of wires results in voltage drops at customers premise, etc.
Further on, we shall focus upon 3 key stakeholders – Customers, Network Operators and Equipment Manufacturers.
INTER CONNECTEDNESS OF OUR GRID AND PQ
Simply put, Power Quality is a measure of quality of power supply on the grid. A PQ disturbance occurs in case of any deviation of voltage and current waveforms from the ideal. Voltage disturbances commonly originate in the network and affect the customers. On the other hand, current disturbances originate at a customers installation and affect the network components and other installations. Therefore, VOLTAGE QUALITY is considered to be primary responsibility of the network operator, while CURRENT QUALITY is primary responsibility of the end-customers.
Because of interconnected grid, PQ disturbances are caused both by upstream and downstream elements. Across various PQ disturbances, it is observed that customers are responsible for roughly 70% of the PQ problems, while the remaining 30% come from the network. One study by LPQI for 25 European Union countries in 2005-06, reported following % distribution of poor PQ electrical manifestation – transients and surges (29%), voltage dips (23.6%), short interruptions (18.8%), long interruptions (12.5%), harmonics (5.4%) and others (10.7%). (See European Power Quality Survey Report)
‘CUSTOMERS’ AND PQ INTERCONNECTION
Today’s customers are highly dependent on digital technology and power electronic devices, with increasing use of various types of electronic appliances, ballasts, variable speed drives, etc. These devices when used produce current distortions in the network due to their non-linear operating characteristics. These disturbances then travel upstream because of insufficient isolation of each customers from the grid. This increase current in turn causes additional energy losses in the system and also pose increased demand of apparent power to individual customer and also entire network faces the risk of premature aging and failure.
Some of commonly reported PQ complaints from end-customers:
Equipments affected by poor PQ
External Manifestation of poor PQ
Electrical Manifestation of poor PQ
IT equipments
Computer lock-ups and data loss
Presence of earth leakage current causing small voltage drops in earth conductors
Variable speed drives, telecom equipments, arc furnace, welding equipment, relays, static converters, security and access control systems, etc.
Motors and drives malfunctioning, computer screen freeze, loss of data
Capacitor bank failure, shocks due to neutral voltage, Flickering of lights, noise in telecom lines
Motors and process devices
Malfunctioning of motors and process devices. Extra heating, decreased operational efficiency and premature aging of the equipments.
Presence of voltage and current harmonics in the power supply
Relays, circuit breakers and contactors
Nuisance tripping of protective devices
Distorted voltage waveform because of voltage dip
Sensitive measurements ofprocess control equipment
Loss of synchronization in processing equipment
Severe harmonic distortion creating additional zero-crossings within a cycle of the sine wave
Table 1. Customers reported problem due to poor PQ Environment (Source: 2. Sharmistha Bhattacharyya and Sjef Cobben, Technical University of Eindhoven)With increased awareness, Customers can take below precautions to support building healthy PQ environment:
Maintain power factor within prescribed limits to reduce reactive power demand, which in turn will balance the voltage in their premise and also overall network
Reduce harmonic currents while using more energy efficient equipments at their premise
Keep a log of faced power disturbances at premises, which may come handy in finding effective solutions
‘NETWORK OPERATORS’ AND PQ INTERCONNECTION%
The Network Operators design and maintain key network characteristics like feeder length, number and sizing of Distribution Transformers (DT), DT load balancing etc. which in turn determine grid impedance and that influence the PQ level in the network. With high impedance in the network, PQ issues (mainly flicker and harmonics) become more prominent. Further, DT winding configurations and earthing problems also add to the harmonic behavior and voltage dips in the network.
Thus, technical Loss reduction and fixing PQ environment are strongly interrelated, and could be addressed though same investments. The main network components which get affected in terms of faster wear and tear through PQ disturbances are:
Transformers
Cables
Power-factor correction (PFC) Capacitors
Protective Devices, Digital Relays
Revenue Meters
The Network Operator can streamline its loss reduction initiatives with improving PQ environment in following ways:
Controlling voltage level at customers point of connection by reactive power management and take appropriate steps at the broader network level.
Maintaining load balance at Feeder and DT level, and reduce current losses. This will ensure increased power availability.
Doing regular PQ Measurements with advancement in technologies like SCADA, Smart Metering, etc. and designing relevant dashboards to facilitate timely actions
Isolating customer loads and their variations from main grid through use of Capacitor banking. Different variants like automatic power factor correcting devices, switched capacitors, Statics VAR compensators, dynamic voltage regulators etc. are available.
‘EQUIPMENT MANUFACTURERS’ AND PQ INTERCONNECTION
Organized and branded Equipment Manufacturers usually specify PQ immunity (EMI/EMC) of their equipment in terms of harmonic current emission and other parameters, as applicable under some Standards. However, in a real life situation, the network voltage is already distorted (and is non-sinusoidal) because of harmonic current emissions from other loads and customers in the network. This can result into distortions from their devices exceeding the ‘compatibility level’ of the system. The optimum performance of Equipment Manufacturers’device is not guaranteed when the supply voltage is distorted. Experiments show that devices produce higher harmonic currents when the supply voltage is distorted. Below table compares total harmonic current distortions (THD) of some households’ devices under sinusoidal and distorted supply voltage condition.
THD with respect to the total RMS current drawn by the device
Under clean voltage condition
Under distorted voltage condition (THD = 6%)
TV
48%
55%
Personal Computer
87%
89%
Refrigerator
10%
18%
CFL
72%
79%
Table2. THD of devices under clean and distorted network voltage conditions (Source: 2. Sharmistha Bhattacharyya and Sjef Cobben, Technical University of Eindhoven)
The device manufacturer, however, cannot be blamed directly for such a situation as he is not responsible for his devices’ operations under a distorted supply voltage condition. But at the same time the manufacturers also need to ensure the immunity of equipments they manufacture against Electro Magnetic Interference (EMI) and specify the tolerance limits for same.
Question is should Manufacturer built in this isolation into its equipments, with resulting price hike, or should customer take collective facility isolation from main grid interference? While answer to this will be driven by market and regulations, still Manufacturers together with their installation teams could start giving weight to PQ issues during their installations and checking some basics like – capacitor bank, cables with larger neutral conductors, adjusting under voltage relays, etc.
CO-CREATING AN ECOSYSTEMFOR BETTER PQ MANAGEMENT
As we saw, poor PQ environment is caused by Customers, Network Operators and also Equipment Manufacturers. At the same time, poor PQ impacts all of them negatively – Network Operator has to face high losses, customers has to face increased break-down of equipments and higher bills, and Equipment Manufacturers has to face increased warranty costs. Therefore, to implement PQ mitigation, a systematic approach needs to be followed starting with to identify the responsibilities of each stakeholder in the network. (A good detailed ‘Decision making flow-chart’ on PQ solutions is shown in report ‘Consequences of Poor Power Quality – An Overview’)
Below figure illustrates the mutual responsibilities sharing among various stakeholders in the network.
Figure 1. Mutual responsibilities among various stakeholders in the network (Source: 1. Sharmistha Bhattacharyya)
With growing complexities both on the on end-customer side (via increasing usage of electronic appliances) and Network Operator side (via higher adoption of smart grids, smart meters etc), it is important that each stakeholders understand their contribution and impact from PQ, and take appropriate measures. End-Customers have to become more aware and demanding in their procurements of both power and also equipments, as at the end, it is them who pays out for these in-efficiencies. In US and Europe, there are clear SLAs for voltage supply and harmonics emission at the point of supply between the Network Operator and end-customers. Improved Regulation, policies, standards and end-customer awareness and reinforcement will play key role in guiding market for optimum equilibria for good PQ environment.
Asia Power Quality Initiative (APQI) aims to create and build awareness on issues related to Power Quality (PQ). The group continues spreading the essential message of PQ to various stakeholders, helping businesses and industries with improved understanding and insights. pManifold is supporting APQI team in content generation and wider sharing of message.
The Uttar Gujarat Vij Company Limited (UGVCL), a second largest state discom in Gujarat serving almost 2.9 million customers, has its network spread across an area of 49,950 Sq. Km. It was the rated the second best state power distribution utility, by the Ministry of Power (MoP), with due recognition to its excellent performance in the financial front, and ensuing operational improvement and consumer-friendly practices.
The discom is forefront in taking effective steps to improve operational efficiency and provide better services to customers. Some of the steps taken have been the introduction of system strengthening schemes, expansion of metering coverage, installation of special design transformers that help in peak load management, an insurance policy to compensate for crops destroyed by fire due to electrical line faults and launch of a photo billing system.
Through these, the utility has been trying to control its rising aggregate technical and commercial (AT&C) losses but also help in peak load management through the installation of advanced metering infrastructure.A brief outline on different types of steps taken by the discom are mentioned below:
Operational performance
The utility’s AT&C losses have been increasing since 2010-11, when these stood at 6.63%. The losses touched 10.12% in 2011-12 and 14.07% in 2012-13; with increase in losses being attributed to low metering coverage of agricultural consumers, which only accounts for 36.75% in 2012-13, as compared to 28% in 2008-09, out of the total 100% metering provided. To address this issue, the utility
Releasing all new agricultural connections at metered tariffs. In 2013-14, it released 22,278 new agricultural connections and additional load of 201 MW for existing agricultural connections, by installing 3000 km of HIgh Tension (HT) lines, and 55 agricultural feeders, following bifurcation of existing agricultural feeders
Launched a state sponsored scheme viz., Jyotigram Yojana, introduced in 2006, which ensures 24×7 three phase quality power, the utility supplies electricity to scattered farm-houses, through feeders with specially designed Jyotigram transformers
Installs AB conductor cables in theft prone areas, undertaking mass anti-theft drives and replacement of electromechanical meters with static meters to bring losses below 20% for feeders with higher losses
Ensures timely and accurate billing in order to reduce losses by initiating photo billing system for 0.2 million consumers, sending billing information to consumers by SMS, and installation of radio frequency (RF)-based single phase meters to avoid human intervention in meter reading
Ensures energy conservation, cost efficiency and reduction in distribution transformer losses, the utility has introduced special design transformers – pilot advanced transformers (PATs) which provides single-phase power supply to farmers after the eighth hour; and this concept won the utility the ‘India Utility Knowledge and Networking Forum (IUKAN) 2014 – Best Practice Award‘ under the “Innovations and Others” category.
Smart Grid Pilot
UGVCL is one of the utility short listed for smart grid initiative under MoP. The project is being undertaken in two districts – Naroda and Deesa. The Rs. 487.8 million pilot project will cover about 375 substations across these districts. The scope of the project covers AT&C loss reduction, peak load management, developing advanced metering infrastructure (AMI), optimisation of unscheduled interchange charge, reduction in meter reading cost, outage management, load forecasting, demand side management and demand response, introduction of asset management systems and power quality management.
Five consortiums were shortlisted for proof of concept (PoC) in March 2014 for demonstrating their AMI connectivity solutions with 300 meters each. On basis of evaluation of PoC and bid price, the contract for the project will be awarded in September 2014. Few challenges faced by UGVCL at tendering stage includes interoperability issues, limited expertise of Indian companies, and absence of mechanisms to test imported technologies in India.
Future Plans
In a nutshell, the utility’s future plans are aimed at strengthening and upgrading its grid infrastructure through various initiatives like adding distribution lines at 11kV and LT levels, including the smart grid pilot. Loss reduction measures and ensuring consumer satisfaction through quality power supply are its top priorities, going forward.
Please note: Above is the summary of the article on Power Distribution Franchisee model published in PowerLine magazine, April 2014.
The Electricity (Amendment) Act, 2014 has envisaged separation of carriage (distribution network licensee) and content (electricity supply licensee). Rationale is to bring multiple supply licensees to increase competition and choice to end-customers, and drive improved efficiency and customer services. The network will be owned and managed by one preferably State agency, and will be regulated.
However there are many questions which still need to be answered clearly, and how do we reach to this new proposed state from existing state. We don’t have answers to all questions, and neither does anyone at this point of time. It has to be evolved, and what better than trying to visualize how this evolution might look like.
In our pictorial representation below, we have assumed base case of one State Discom utility, running one Input based Distribution Franchisee model in its one town, and how it might evolve. This is hypothesis, and idea is to invite expert comments to further improve this base view, and arrive at may be some kind of common visualization, as how our electricity distribution market will evolve, and in what time horizon.
Since, Electricity requires physical carrier (wire), it is recommended to not go for strict separation of wire and retail businesses between different entities. The last mile ‘Retailer’ (also referred as supply licensee) will be required to also play role of last mile ‘Network O&M’ agency. The Distribution Licensee can own all Network, with its responsibilities and investments limited till 33/11 KV sub-stations.
We look forward to good discussion on what you agree and don’t agree in above depicted evolution path
The Indian Power Distribution landscape is changing rapidly and going through various developments and reforms. In addition to high AT&C losses, the sector is struggling with increasing share of power purchase costs and financial constraints. Further, unforeseen shortages of fuel and poor planning by power distribution companies (discoms) has led to a steep rise in the power purchase costs – the key reason for widening the gap between discoms costs and revenues.
Power purchase cost is the major portion (in the range of 70%-80%) of the total cost of supply and are outside the direct control of most distribution utilities in India.To add to woes, the financial position of the state electricity distribution sector has been a concern for over a decade.
The financial restructuring plan announced by government is expected to bail out the sector temporarily but in the long-term functional autonomy of discoms, reforms at the distribution level and investments to augment capacity is required to supplement the restructuring plan. Hence, power procurement cost reduction forms the strategic priority for most distribution utilities.
The current sources of power procurement are also a mix of sources from Central, State and Private sectors for most distribution utilities. The typical energy mix for Discoms is 80% Coal, 15% Hydro and the rest from other sources like Wind, Solar, etc. Short-term power purchase transactions contribute a very small fraction for most utilities.Some of the key reasons for increase in power procurement costs include,
Rise in generation costs, primarily because of hike in fuel prices
Transmission charges – inter and intra state
In addition to above, discoms has been facing challenges in assessing/forecastinginput energy demand due to the uncertainty of weather, T&D losses, changes in policy and other economical factors that drive industrial consumption. Most discoms uses mixed methods (trend analysis, in-house built tools, etc.) for load forecasting however, there is a need for national level demand side datasets to be made available for improving load forecasting. Although power purchase guidelines exist, discoms needs to be better equipped to deal with estimation of demand forecasting and scheduling.
Good load forecasting tools will help discoms manage variability in power procurement, which is a major challenge as of today. The demand for reducing power procurement costs is being driven through regulations and also due to the viability concerns for the discoms themselves. Hence, in order to reduce the power procurement costs, regulators continue to consider various policy level initiatives like driving O&M efficiencies of state generating plants, reduction in transmission charges, availability of imported coal at affordable costs and others.
Summarizing, given the high priority for power procurement cost reduction, the discoms need to undertake interventions like lowering of AT&C losses &hence quantum of energy procurement for same amount of revenue collections, use of load scheduling, power trading and banking, increasing renewable mix in power procurement (to mitigate rising fuel prices hike).
There has been a continuous and growing interest for grid connected solar rooftops across India. This is primarily due to shift in consumer behaviour across all consumer categories (residential, industrial, commercial, etc.). The consumer is not just interested in consuming electricity but also producing it. By installing solar in their own premise, they can now produce and save on electricity bills. This prosumer behaviour is expected to rise further and attract more interest and investment on solar rooftop models.
Each state has its own load profile and installation capacity. Hence, to match up the industry trend, ensure grid stability, reduce environmental impact and power companies’ losses, the solar rooftop policy varies from state to state. In general, we cannot say which state has a best solar rooftop net metering policy as there are several factors which need to be considered while making a comparison.
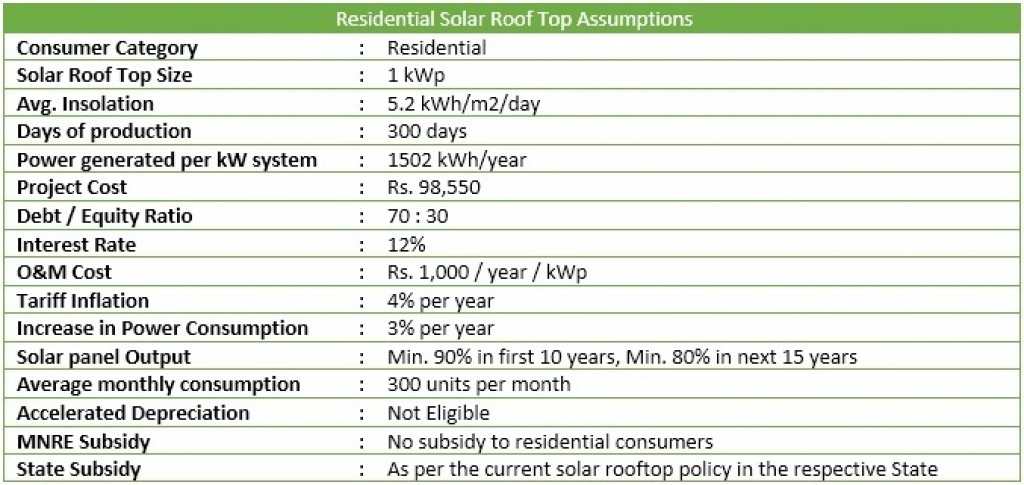
In this blog, we have compared the solar rooftop policy of three states for residential consumers: Tamil Nadu, Andhra Pradesh, and Karnataka. The key assumptions considered for comparison are mentioned below,
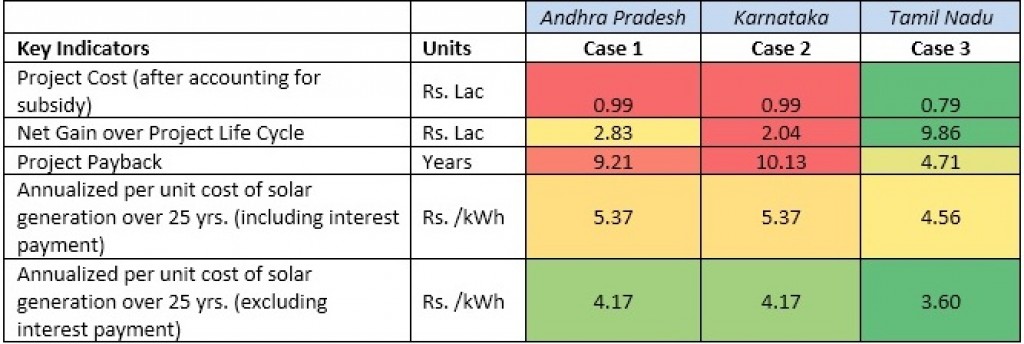
The simulation result of above parameters for three states is shown below,
Conclusion:
In residential solar rooftop with the 1kW system, Tamil Nadu has a favourable policy (payback less than 5 years) among the three states because of the subsidy provided by state government.
For given power consumption level, the bill saving due of Andhra Pradesh consumer is higher than Karnataka. This is mainly due to the tariff slab difference between the two states.
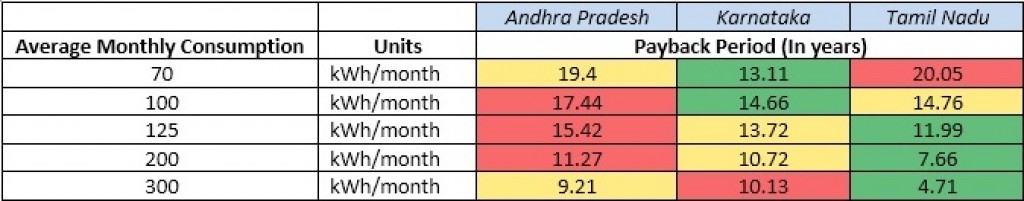
Scenario Analysis 1: Average Monthly Consumption Vs Payback Period (In years)
Higher the monthly units consumed, higher the power tariff and hence the electricity bill. Therefore, every solar unit generated will deduct one unit from higher power tariff slab. Below is the scenario analysis performed to check the impact on payback period by changing the input parameter ‘monthly consumption’ and keeping other parameters same.
Conclusion: The payback period is dependent on consumer tariff slab, monthly power consumption, and solar generation capacity.
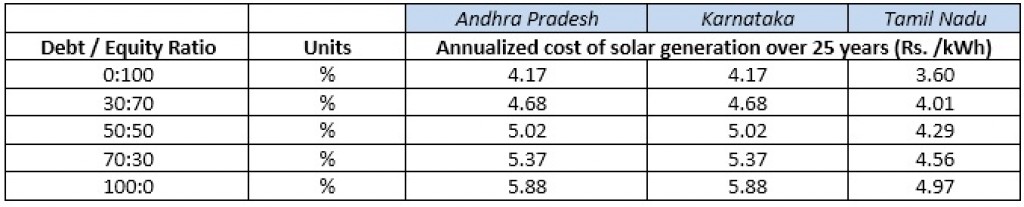
Scenario Analysis 2: Debt Equity Ratio Vs Annualized cost of solar generation over 25 years
Below table summarizes the impact of interest rate and debt portion on annualized cost of solar generation over 25 years.
Conclusion: The debt portion has a significant impact on annualized per unit cost of generation. The cost per unit may go up to 42% higher when compared with no debt situation.
Overall Remarks
In general, the payback period for 1kW solar rooftop system is 10 to 15 years without subsidy. Keeping in mind, MNRE priority on residential buildings is lower and high payback period, the adoption of grid connected solar rooftop may take more time to unlock the potential residential category promises. Hence, state government needs to step forward to provide financial assistance to meet their renewable targets by 2022.
Similar kind of analysis can also be extended to compare the solar rooftop policy for other consumer categories (commercial, industrial, etc.). In such case, the benefits like a central subsidy, 80% accelerated depreciation, MAT credits, etc. also needs to be properly accounted to determine the solar project feasibility and tax liabilities for project developers.
India has a momentum with National Solar Mission with a goal of 40 GW IN 2022 for rooftop and recently, the goal for solar is extended to 100 GW in 2022. India and France launched International Solar Alliance to boost solar energy in 121 countries with an aim to deliberate on a finance mechanism for the promotion of solar energy in member countries, crowd-funding and technology transfer.
India’s present rooftop solar installed capacity is 1.9 GW which is 10% of total installed capacity of solar energy. Indian rooftop solar market is in nascent stage but government has an ambitious target of 15 GW by 2022. To add, several banks, including the State Bank of India (SBI) and Punjab National Bank, have committed to providing financing support to rooftop solar projects.
The World Bank announced a $625 million loan to SBI to provide discounted finance for rooftop solar installations on factories and institutions.
The environmental profile of rooftop solar is impressive compared to other renewable energy sources. Solar panels generate electricity with no air or carbon pollution, no ash or other waste products, and no inputs other than sunlight. Individuals and businesses have been attracted not just to the environmental benefits of solar power, but also to the ability to generate their own power.
Some of the major advantage of installing solar rooftop are:
Cleaner source of energy
Reduces imports of fossil fuel
Reduces dependency on grid power
Provides financial benefits as surplus energy produced is paid back (in the form of reduced electricity bill) by utility
Reduces T&D losses
As renewable energy is gaining popularity, the solar industry is growing very fast. But there are also challenges related to it. Some of them are listed below.
Variability and uncertainty of sunlight
No specific central regulation for solar PV power quality in India. As a result, validating the power quality of solar PV differs from state to state.
Massive exercise for DISCOM to keep check on power quality.
Criticality in performance measurement of Rooftop solar and inverter
No regulation for frequency response.
Karnataka is the only state in India having mandate for reactive power support.
No alternatives to meet contingencies of power flow.
Absence of accurate forecasting mechanism
Integration of rooftop solar has considerable impact on the grid which can be divided into technical and commercial impacts as mentioned by experts in APQI Webinar on ‘Impact of solar net metering on grid stability and preparations that Discoms can undertake’
Technical
Increases voltage rise, voltage imbalance and instability
Increases losses in the system and creates system protection issues
Stability of the system also hampers due to weather fluctuations.
Increases frequency fluctuation
Commercial
Initial installation cost is very high
Consumer is already sensitive and injection of solar system increases it
To overcome all the problems and make system more reliable and efficient, Discom has a vital role to play. Some of the major steps that DISCOM should undertake are as follows.
Participate from project development, installation and O&M stage for RTS.
Be proactive and consider RTS as a tool for providing supply
Act more like system operator and not network maintainer and power purchaser
Be brought on board through a technical and financial support
AMI should be used which enables accurate data gathering and establish two-way communication channel
Smart meters should be used to mitigate several grid integration challenges like transients, flickers, voltage fluctuations etc.
Energy Storage system (ESS) can be used which helps in proper demand supply management.
Micro grid controllers should be used as it helps in management of solar variability and uncertainty.
Conclusion: One of the important aspect to reduce the impact of roof top solar integration is to think of protection system for reverse power flow as current protection system is designed for unidirectional power flow. Load flow study needs to be done so that deciding capacity of distribution transformer for rooftop solar system gets easier.
The successful implementation of net metering policy will be critical for solar roof-top to grow in commercial and industrial segment. Different steps are already being taken by government such as National Smart Grid Mission, National Energy Storage Mission is in planning stage.
Discoms must be brought on board through a technical and financial support package. Policy interventions by MNRE such as offering rooftop solar power a higher Renewable Purchase Obligation (RPO) credit can incentivize the Discoms to fulfill more of their RPO requirement. Such steps will reduce the perceived investment risk associated with the sector. Its implementation and proper functioning will be the key to scale up roof top solar and achieve the target of 40GW by 2022.
pManifold was the knowledge partner at 2nd Annual Electric Vehicle India Summit 2019 which was held from 25th – 27th February in Delhi organised by Explore Exhibition
The Summit was held for 3 days. 1-day Workshop followed by 2 days Conference where various EV Thought Leaders imparted knowledge & shared their insights with the audience.
Day 2 Rahul Bagdia, Director and Co-Founder, pManifold Business Solutions Pvt. Ltd. Moderated Panel Discussion:
What Indian EV industry needs in terms of policy changes in order to create the thrust.
EV Policies & Regulations – Current EV policies and regulations and their implications. How the federal, state, and local regulations interact with one another
Moving forward: What to expect from the new policies & their regulatory standpoint. Best practices & FAQs in regulatory frameworks to facilitate market-friendly uptake programs
Electric Vehicles moving forward? – The current state of Electric Vehicles, manufacturer’s perspective
Presentation coverage by Rahul Bagdia:
Day 3 Rahul Bagdia was a speaker and spoke on An in-depth survey into the possibilities for e-2 wheelers and e-4 wheelers fraternity.
Presentation : EV Charging Economics for 2W, 3W, 4W and Bus, and associated Private Investments & Financing
EV Adoption & Maturity across Vehicle Segments
Mix of EV Charging Options and Infra at City Level
Economics for EV & Charging
Business Models, Investments & Financing
pManifold launched “India EV Outlook Survey 2019Q1” during EV India Summit 2019 to consolidate industry views around some of the most important questions around EVs and India forward standing. Speakers & Participants actively participated in LIVE POLL and received an opportunity to see LIVE results.
Indian Power market has fast changed and further evolving post unbundling reforms. There is rapid emergence of various private/PPP models across Power Distribution. There is high attractiveness of the end B2C Power Distribution business, as it brings cash for all other businesses in the value chain. The recent surgence of Franchisee models in Distribution has raised the end-service delivery & price value expectations of the end-customers, which is putting more and more pressure on utilities to bring efficiencies and streamline their operations and overall IT.
pManifold team recently spoke to Mr. Ananth Chandramouli, Head – Energy & Utilities, Infosys to understand about their IT solutions Utility-in-a-box (UIB), an innovative cloud-based platform for Utilities. The below shared are author’s personal views and not to be associated with any of their company’s association.
Q1) Please elaborate Infosys’s Utility-in-Box (UIB) IT solution? (phase wise Modules implemented, current deployment stage (whether LIVE), key features, hardware requirements, team size for setup and regular running, business engagement model (Capex vs. Opex based), next planned add-ons, etc.)
A)
Infosys UIB is a cloud based solution suitable for Utilities and Distribution Franchisees (DFs). The complete platform including hardware, software, data centre etc. is hosted and managed by Infosys and available on “pay as you go” (opex) model to the Utilities/DFs. Only network connectivity at site and office infrastructure (PCs, printers etc.) has to be procured by the Utility/DF. Infosys has already done capital investment in the state of the art centralized IT infrastructure, which can be shared by multiple DFs/Utilities. This helps DFs in two ways.
First, the CAPEX cost for IT is converted into recurring OPEX cost; this not only provides cash outflow predictability but also reduces the debt/equity investment by DFs.
Second, this common infrastructure is designed to be used by multiple DFs hence the cost of hardware, software and services cost are apportioned amongst multiple users. This allows DFs to use this infrastructure at the fraction of the cost that they would have to shell out if they buy such systems at their own.
UIB has pre-configured, field tested and optimized processes complying with Indian regulatory requirements so it is fast to implement and can be made up and running in about 3 months either in a big bang or phased manner depending on the readiness of the Utility/DF. This allows DFs to save substantial cost and time. It covers all key utility processes such as Connection Management (New Connection, Change of Name, Meter Shifting, Reconnection, Load Enhancement), Meter to Cash (Meter Reading, Tariff Administration, Billing, Collection), Revenue Assurance and Recovery (Disconnection and Dismantling, Vigilance), Meter Data Acquisition and Energy Audit (Meter Data Acquisition, Meter Data Management, Validation, Estimation and Energy Audit), Customer Care, Work Asset Management and Maintenance Management.
UIB is Smart Grid ready and the next avatar of UIB will have even more features to help Utilities/DFs realize the vision of Smart Grid without making huge investments in IT. Few of these features are – AMI based centralized prepayment, Remote connect/disconnect, Demand Response etc.
Q2) What specific challenges, if any, you see that DF client faces, which impact the IT solution framework, its implementation approach and business engagement model?What further change or clarity that you believe the DF industry should bring for reducing gestation and expediting operations?
A)
By implementing modern IT systems such as UIB, DFs can add immense value to the whole ecosystem by providing cost effective services to consumers e.g. through innovative pricing structure and modern ways of monitoring system performance e.g. remote theft detection and disconnection.
UIB can identify loss making areas and even suspicious cases by correlating metering, billing and collection data with system meter data and consumer smart meter data (if available). UIB can also help in remote connect/disconnect if this feature is supported by the meters in field. But all this would need involvement of licensee and regulator.
Regulators have to allow DFs to offer different tariff structure in their area of operation, which would need support and approval from licensee. So there is need to evolve simple, clear and equitable regulatory regime for DFs. This will help expedite decision making by DFs and help in creating win-win situation for all stakeholders (Consumer, Utility and DF).
Q3) Share your specific experiences and challenges in rolling out first billing from new IT system.
A)
Rolling out first bill from any new IT system is challenging and needs very detailed planning and meticulous execution. There are several aspects that one should consider while planning such transition.
Firstly, getting accurate data dump (consumer and billing) from legacy system could be challenging and should not be underestimated. Even after getting this data, sanitization, cleansing and back-filling missing data can take substantial time and effort. This may even require field level validation in some cases and use of customer indexing data (if available).
Secondly, there could be difference between bills generated from the new and the legacy system due to interpretation of some rules and regulations. Here a highly skilled team from DF and SI should verify the logic of both the systems and then decide between the right and wrong instead of trying to match the output of the new system with the legacy system.
Most importantly, the new system could create confusion and anxiety amongst consumers so change management for consumers should also be part of the plan. Consumers should be informed about the timing of this change through direct communications and through other channels, special crack teams should be deployed at all customer care offices to handle rush of customers and backup plan should be always ready. Thankfully, we have predefined templates and standard operating procedures (SOP) as part of UIB to manage this transition.
Q4) What customer side best services difference the new IT system will start bringing to DF? Any first results from UIB implementation already benchmarked with previous performance?
A)
The most significant benefits for customers are enhanced convenience and transparency. Due to automation of business processes, service time for customer requests can be substantially reduced e.g. new connection can be released in 2-3 days in normal cases, payment updates happen in real-time avoiding any wrong billing or disconnections etc.
Customers can get update on their requests/complaints anytime anywhere through call centre, web self-service portal or DF offices. Since UIB is a centralized system, customers get same information at all the touch points adding to the transparency and also helping build trust.
UIB allows customers to manage all their interactions with DF such as bill payment, enquiries, applying for any services etc. through online self-service portal available on web and mobile devices thereby improving convenience.
Q5) How do you see pricing evolving for managed IT services within utilities and specially DF? (Many a times an IT Partner takes too many things on plate, while DF first needs only a good Billing and CRM solution. Does right incremental pricing will allow DF to harness best practices over time cost effectively, including adding GIS, SCADA, AMI, smart metering, etc?)
A)
This is a very important point. DFs should choose IT solutions and do a phased adoption based on the expected business outcomes. As you rightly said, Billing, CRM and associated process should be targeted first, followed by asset management system. GIS, SCADA etc. can come later. However it’s important for DFs to prepare a clear roadmap for all these technologies along with the selected IT partner. This roadmap should consider several aspects e.g. Growth – Growth in number of customers either within DF or through acquisition of new DFs can alter the choice of technology.
Diversification – The choice of promoters to enter into multiple utility services (electricity, water, gas) can have huge impact on the solution choice. Demographics and local situation – Local issues and other requirements of local people can also impact technology choice.
A roadmap based on these blocks will allow DFs to absorb change in an incremental manner and also allow incremental pricing with the additional of new features and functionalities.
Q6) No one in India is offering GIS on cloud as Managed services, and it remains one critical component to rightly archive ‘Data’ and base Capex and O&M planning. What is your take?
A)
No doubt GIS can help improve operational efficiency and planning but right now most of the DFs and Utilities are in a state where they have to set their house in order with basic IT systems such as CRM, billing, asset management etc.
Once they are able to improve their performance by targeting “low hanging fruits” then they can move to GIS and other advanced systems for efficiency gains. However we do appreciate that DFs conduct customer indexing and asset mapping exercise before takeover and this data could be very helpful for a GIS implementation later on.
DFs should initially maintain this data in asset management system and add GPS coordinates and other attributes to it whenever they plan to implement GIS. There would definitely be players in the market to offer such solutions on cloud when the market achieves this maturity.
Q7) Infosys earlier has supported in defining road-map for smarter Indian power distribution utilities. How much are we track on that, and where you see major divergence or lack?
A)
We recommended a three step road-map over a period of 15 years for Indian power distribution sector to move to smart grid.
The realization of first step is happening through implementation of RAPDRP. Though the program is running a bit slow and there are some challenges in achieving complete benefits of R-APDRP but it’s a positive move in the right direction and will bear fruits in time to come.
We are also witnessing action on second step through 12 smart grid pilot projects supported by Ministry of Power. These pilot projects will definitely dovetail into larger smart grid projects over time.
Third step, which is about achieving a system that could support seamless and bidirectional flow of energy and data, will take some time to evolve. Overall things appear to be on track vis-à-vis the roadmap.
Some recent discussion on best practices at Linkedin Power Distribution Franchisee group have started discussing the role of Customers in helping reduce AT&C losses. Some key excerpts:
” …. I strongly feel that key factor for reduction of AT&C loss is very much linked with consumer care initiatives and winning consumer confidence. With the support of consumer group one can control the theft by providing new connections thr’ camps etc, one can initiate and execute loss reduction schemes in fast mode, one can get information about theft at particular location etc.” (Sr. utility professional with experience at one of biggest private utility)
” …. The whole problem with Utilities & Consumers relationship whether the utility be govt controlled, pvt utilities, Joint venture or DF, is the major trust deficit. Any utility ownership change when it come to DF or complete Pvt, utilities starts its business with an approach that all consumers are stealing so should start with dent on it whereas consumers always thinks of Utilities as somebody there like a Police which is there to unnecessary harass consumers…” (Mgmt. Consultant in Utility domain)
“…. Real work can be started somewhere after Oct and with this they will get around 5 months to get ready for next summer peak. In this 5 months, they can focus on low hanging fruits for reducing losses and enhancing recovery along with work of increasing confidence in consumers by starting customer centres, call centres etc. With this they will get almost 7 months to positive brand image before next summer peak or storm winds ( which are generally in last Feb early March) in Chambal River areas….” (Sr. utility professional with experience at one of biggest private utility)
“…. In common nature, the employees of MPSEB will do the maintenance work half heartedly. It results, the failure of Distribution Transformers, Power Transformers and Breskdowns of 33, 11KV & LT lines. So the DF’s Material department have to plan for procurement of materials and appointing Contractors for the above activities. Otherwise, the harassment from consumers will be faced by field officers on large scale” (Sr. utility professional with experience at one of operating Distribution Franchisee)
The above comments bring interesting set of related questions:
Are forced customer behaviors (like theft, aggression, default, late payment) resulting from poor utility service quality and delivery, or inherent human behavior?
Can improved ‘Customer co-operation’ help utilities to expeditedly undertake AT&C loss reduction?
In Indian utilities, there is still not much appreciation of ‘Customer Engagement’ and its role to reduce ‘AT&C losses’, which is core for all Distribution reforms (including the emerging Distribution Franchisee business model). One definite reason for this overlook is the regulated and monopolistic utility market structure in our country.
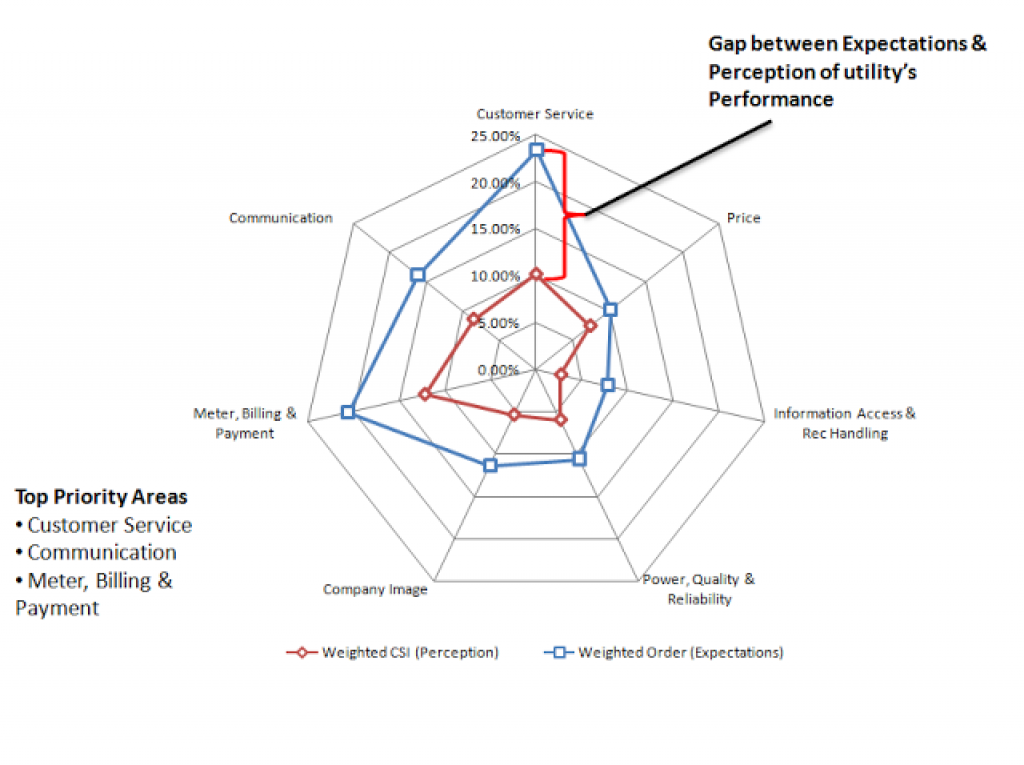
There has always exist a gap between the Customer ‘perception’ (how he sees service delivered to him) and their ‘expectations’ (what he wants from the service). The wider the gap and more its overlooked, there will be increased occurrences of forced customer behaviors, which accounts for significant AT&C loss.
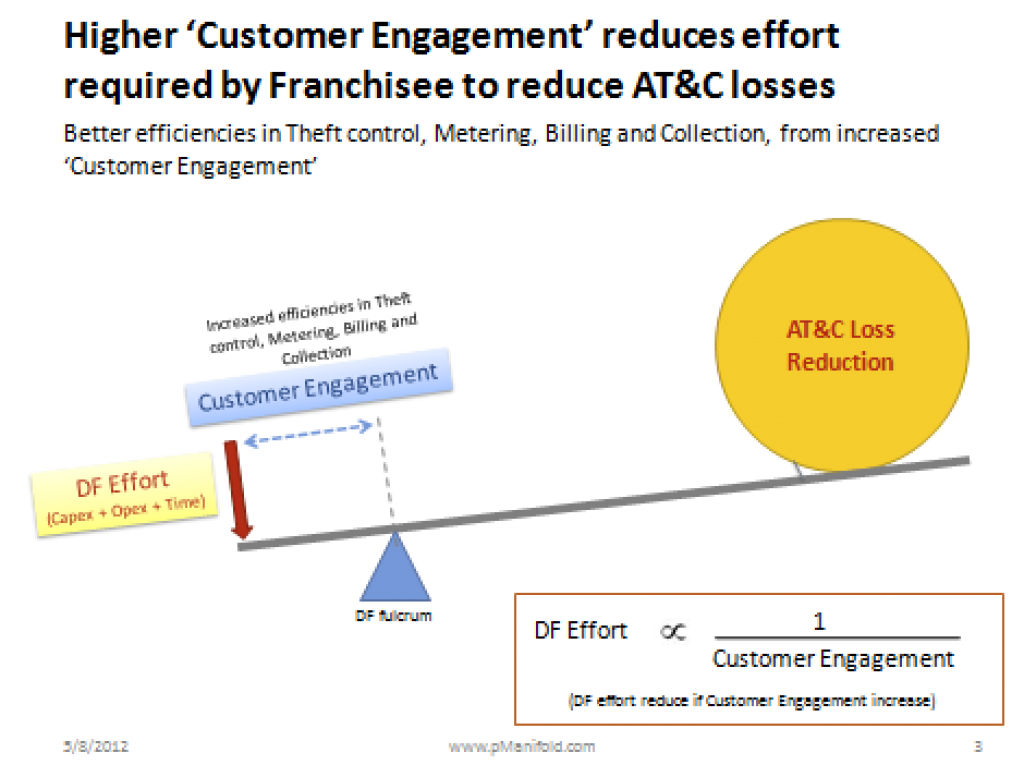
At pManifold, we see following connection as how AT&C losses can be influenced through improved ‘Customer Engagement’:
AT&C loss reduction is core to Utility (Discom, full privatized or Distribution Franchisee) success
Commercial losses form significant part of AT&C losses
Commercial losses contributed by customer’s ‘forced behavior’
Managing customer’s ‘Perception’ is key to reduce forced behaviors
Building ‘positive brand image’ is necessary to manage Perception
Listening to customers & Engaging them positively will build positive brand image
This Customer Engagement will drive overall ‘Performance’ (Customer, Operational and Financial) enhancement through internal process refinement
Continuity in Customer Engagement and Monitoring essential for effective utility Life Cycle Management
Your comments on our hypothesis are welcomed. One of our broad aim through this work with Utilities is to support a Customer driven Governance & Transformation in Indian utilities, and position Customer Engagement as one of the important tool for success of Franchisee business.